Oct 26, 2026 · 13 min read
Meta Ad Fatigue: The Signs That Show Up Before ROAS Drops
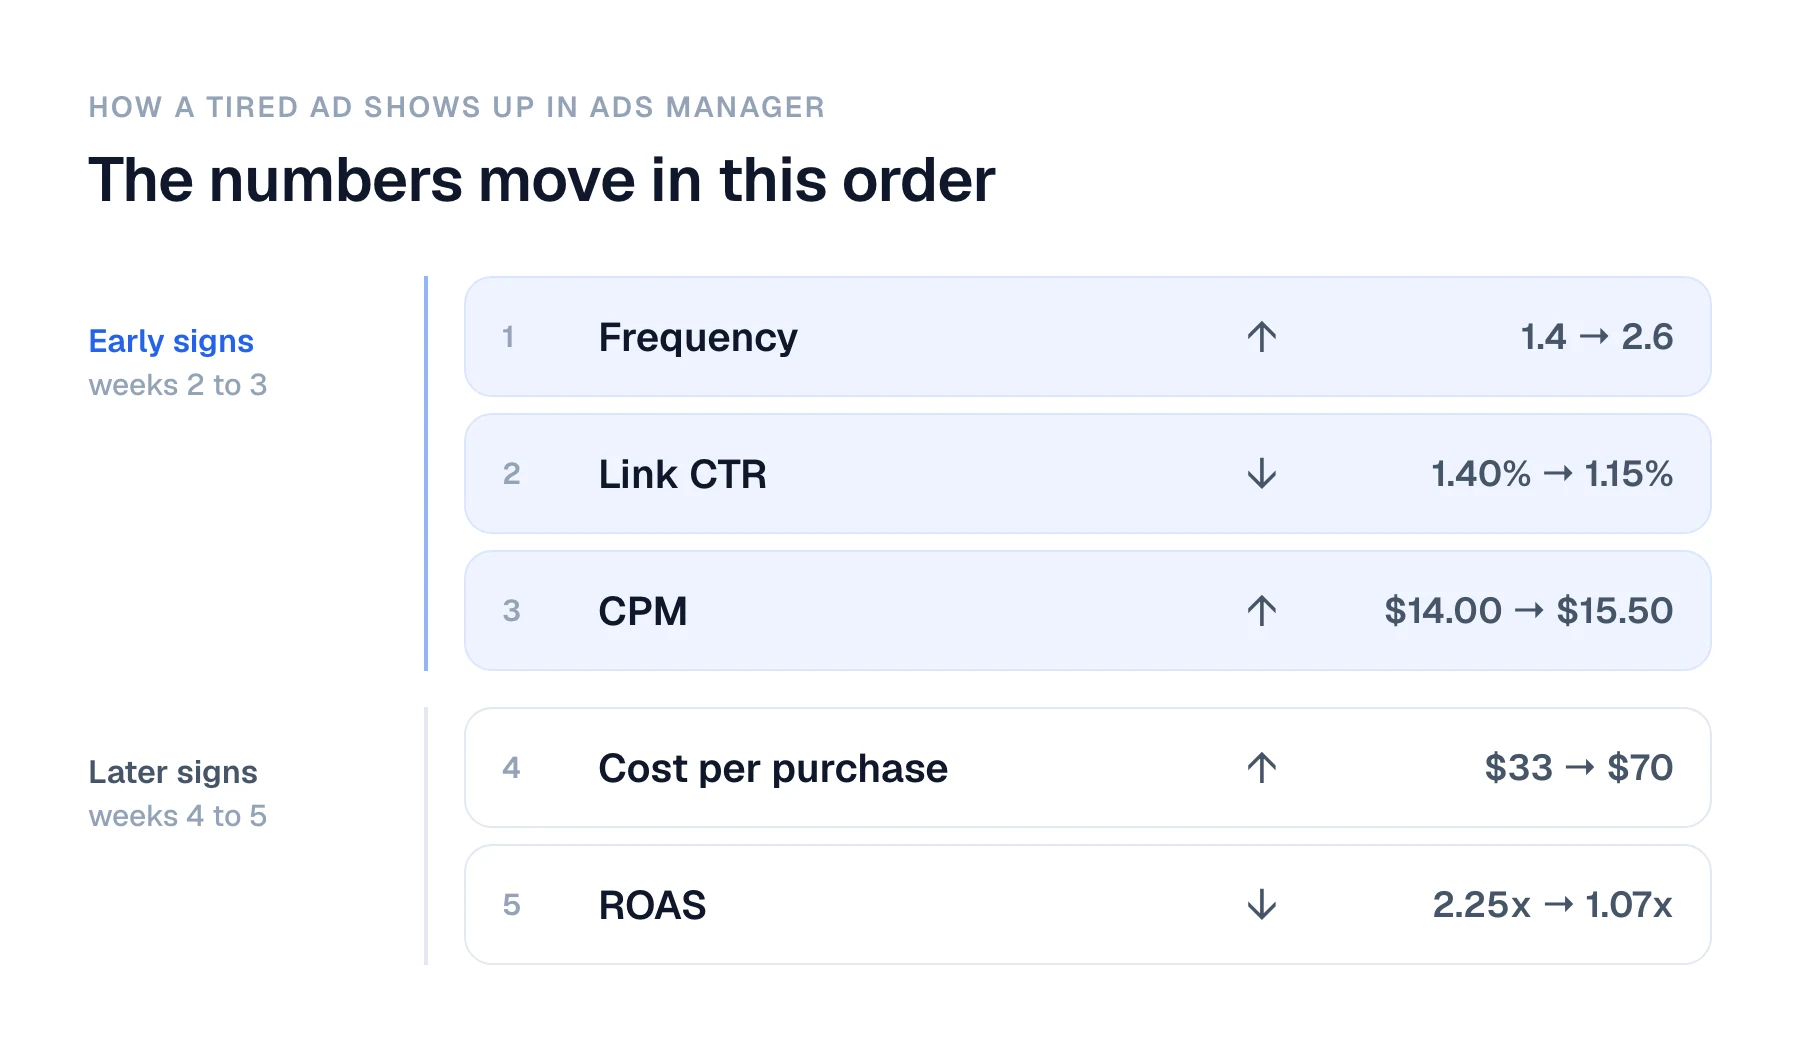
Meta ad fatigue is when the same people see an ad so often that they stop responding to it. It shows up in Ads Manager in a fairly steady order. Frequency rises first, then the click-through rate (CTR) falls, then the cost per 1,000 impressions (CPM) rises, and only after that do cost per purchase and return on ad spend (ROAS) get worse. That gap is usually one to three weeks. If you check frequency, CTR and CPM for each ad every week, you can replace a tired ad before it costs you a month of weak sales.
This guide shows the order the numbers move, using one example ad over five weeks. It also explains how to confirm fatigue in your Shopify orders, how to tell it apart from a saturated audience or a seasonal price rise, and what to change first. The example store and its numbers are made up, but they are in realistic ranges for a Shopify skincare brand.
What Ad Fatigue Is, and What It Isn't
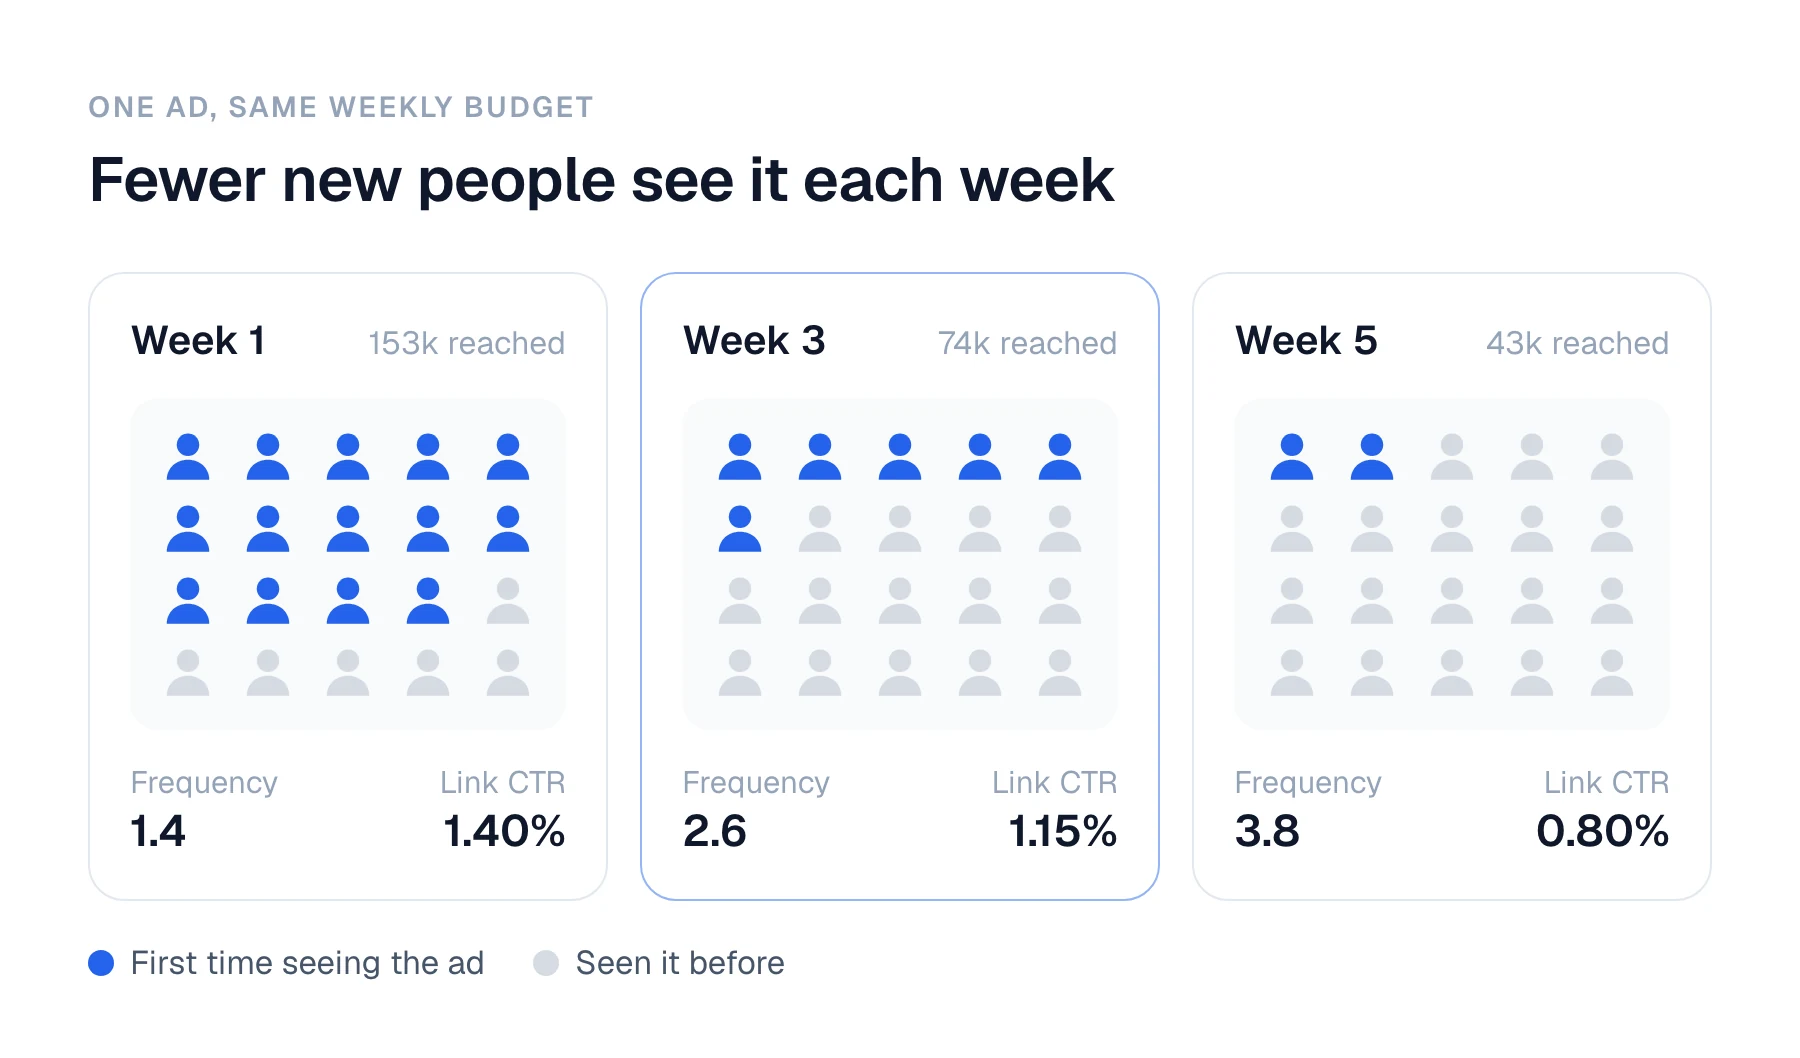
Ad fatigue is a problem with one creative, which is the image or video and its copy. People in your audience have seen it several times, so fewer of them click, and Meta has to pay more to show it to the few who still might.
Two other problems look similar in Ads Manager, and they need different fixes:
- Audience saturation is a problem with the audience, not the ad. You have reached most of the people Meta can find for that ad set, so every ad shown to them gets weaker at the same time.
- Seasonal cost rises happen when many brands bid for the same people at once, such as during Black Friday and Cyber Monday (BFCM). CPM goes up for every ad, including fresh ones.
The fixes are different. Fatigue needs a new creative. Saturation needs a wider or different audience. A seasonal rise often needs no change at all, because conversion rates usually rise during the same weeks. The section on telling the three apart, further down, shows how to decide.
The Order the Numbers Move
Each of these numbers is a column in Meta Ads Manager. You can add any missing ones through Columns → Customize columns and save the view so you can reuse it each week.
- Frequency is the average number of times each person saw the ad in the date range. It is impressions divided by reach. When frequency climbs, the ad is going back to the same people more often.
- CTR (link click-through rate) is the share of impressions that led to a click to your store. It falls as people get used to the ad and scroll past it.
- CPM (cost per 1,000 impressions) rises because Meta prices delivery partly on how likely people are to respond. A weaker ad costs more to show.
- Cost per purchase rises because you are paying more for each impression and getting fewer clicks from them.
- Purchase ROAS falls last. It often holds up for a while because the people who still click tend to be the most interested, so the conversion rate on those clicks can stay level or even improve slightly.
There is no single number that proves fatigue, so treat these as rough warning levels for prospecting ads, which reach new people. Sources that track many ad accounts, such as Atria and Benly, put them in similar places:
| Signal | Worth watching | Likely fatigue |
|---|---|---|
| Weekly frequency (prospecting) | Above 2.5 | Above 3.5 |
| Link CTR compared with the ad's first two weeks | Down 10% | Down 20% or more |
| CPM in a normal week, with no change to budget or audience | Up 10% | Up 15% or more |
Retargeting ads, which reach people who already visited your store, can run at a frequency of 4 to 6 before they weaken, because those people are already interested. Judge them against their own history, not against these prospecting levels.
A Worked Example: One Ad Over Five Weeks
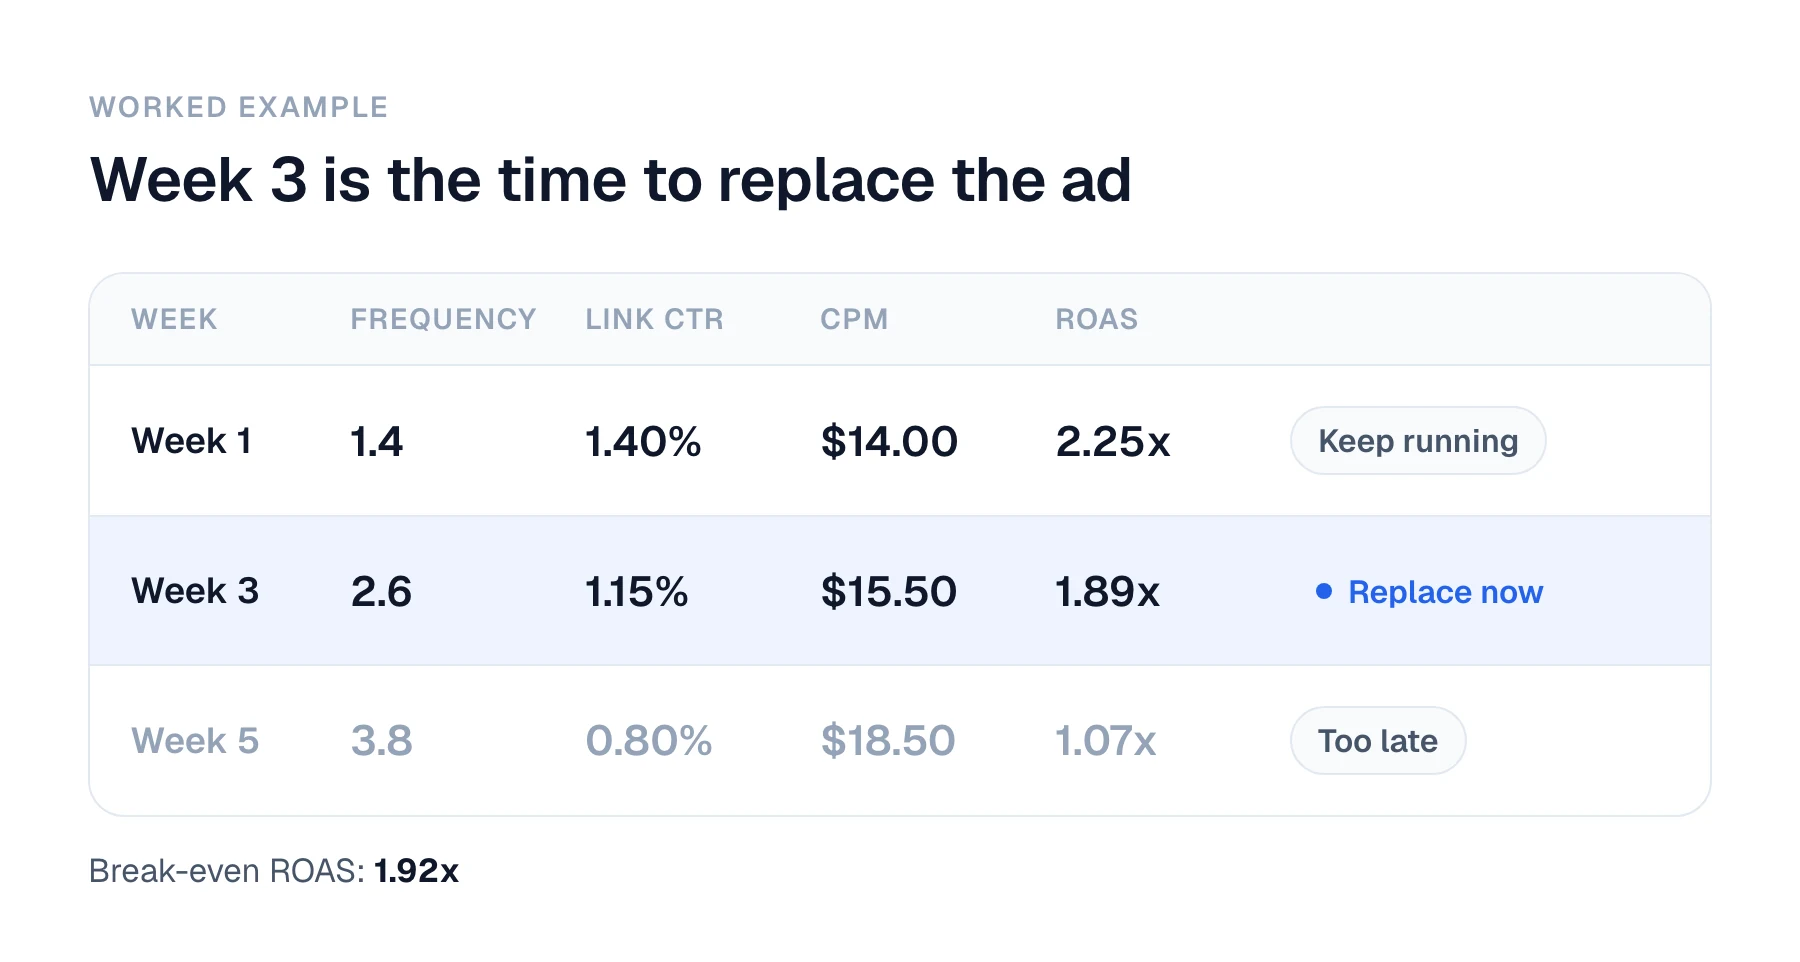
Say you sell a $75 skincare set, and one prospecting ad on Meta spends $3,000 a week. The contribution margin on each order, after product cost, shipping, payment fees and returns, is 52%. So the break-even ROAS for this ad is 1 ÷ 0.52, or about 1.92x. Our ROAS guide explains where that number comes from.
| Week | Frequency | Link CTR | CPM | Cost per purchase | ROAS |
|---|---|---|---|---|---|
| 1 | 1.4 | 1.40% | $14.00 | $33.33 | 2.25x |
| 2 | 1.9 | 1.33% | $14.50 | $35.17 | 2.13x |
| 3 | 2.6 | 1.15% | $15.50 | $39.64 | 1.89x |
| 4 | 3.2 | 0.95% | $17.00 | $52.63 | 1.42x |
| 5 | 3.8 | 0.80% | $18.50 | $70.08 | 1.07x |
In week 3, frequency has passed 2.5, CTR is 18% below week 1, and CPM is 11% higher. ROAS is down 16% and is just under break-even, so the ad looks a little soft but not broken. That is the week to act. By week 5, cost per purchase has more than doubled and ROAS has fallen 52%. The ad lost money in weeks 4 and 5 that it didn't need to lose.
Reach fell every week too, from about 153,000 people in week 1 to about 43,000 in week 5, while spend stayed the same. Meta was showing the ad to fewer new people and more repeat viewers. Falling reach at a steady budget is often the earliest sign of all.
Meta's own warning arrives late. The Delivery column marks an ad as "Creative fatigue" when its cost per result is about twice that of your past ads, according to several ad-ops guides. In this example, that only happens in week 5.
Checking this ad by ad each week takes time once you run more than a handful of ads. In Daymark you could ask, "Why did CPA go up last week?" and get an answer that traces the change to the campaigns and ads behind it. That lets you replace the tired ads on Monday instead of finding them a month later. Read more about comparing ad spend with the orders it actually produced.
Confirm It in Shopify, Not Just Ads Manager
Ads Manager tells you what Meta thinks happened. Shopify tells you what your store actually sold. Before you change anything, check that the drop shows up in your orders too.
- New customers from Meta. In Shopify admin, go to Analytics → Reports and open the report that splits sales between first-time and returning customers. Then filter or group it by traffic source or UTM campaign, if your Meta ads use UTM tags. A fatigued prospecting ad shows up as fewer first-time orders from Meta, while returning customers keep buying as usual.
- Orders that Meta claims but Shopify can't match. Meta counts some purchases from people who only viewed an ad, and it estimates others. Those numbers can stay level while real orders fall. Our guide to why Meta and Google revenue doesn't match Shopify shows how to match them up.
- Discount use on first orders. If first orders from Meta start using your welcome code much more often, the ad may still be getting clicks from people who were going to buy anyway, while it stops reaching new buyers.
The reason to check Shopify is that Meta can report a steady ROAS while new-customer orders fall, especially when retargeting and view-through purchases fill the gap. Our guide to counting your real CAC from Meta in Shopify walks through the steps.
In Daymark, the same check is one question: "Is Google or Meta bringing better customers?" It compares new customers, first-order value and repeat orders by channel using your Shopify orders, so you can see whether a weaker Meta week reached your store or only Meta's report. Read more about finding out why your Shopify sales changed.
Fatigue, Saturation or Seasonality?
The simplest test is to compare ads that run to the same audience. If one ad is getting weaker while the others hold steady, the problem is that ad. If every ad in the ad set gets weaker together, the problem is more likely the audience or the season.
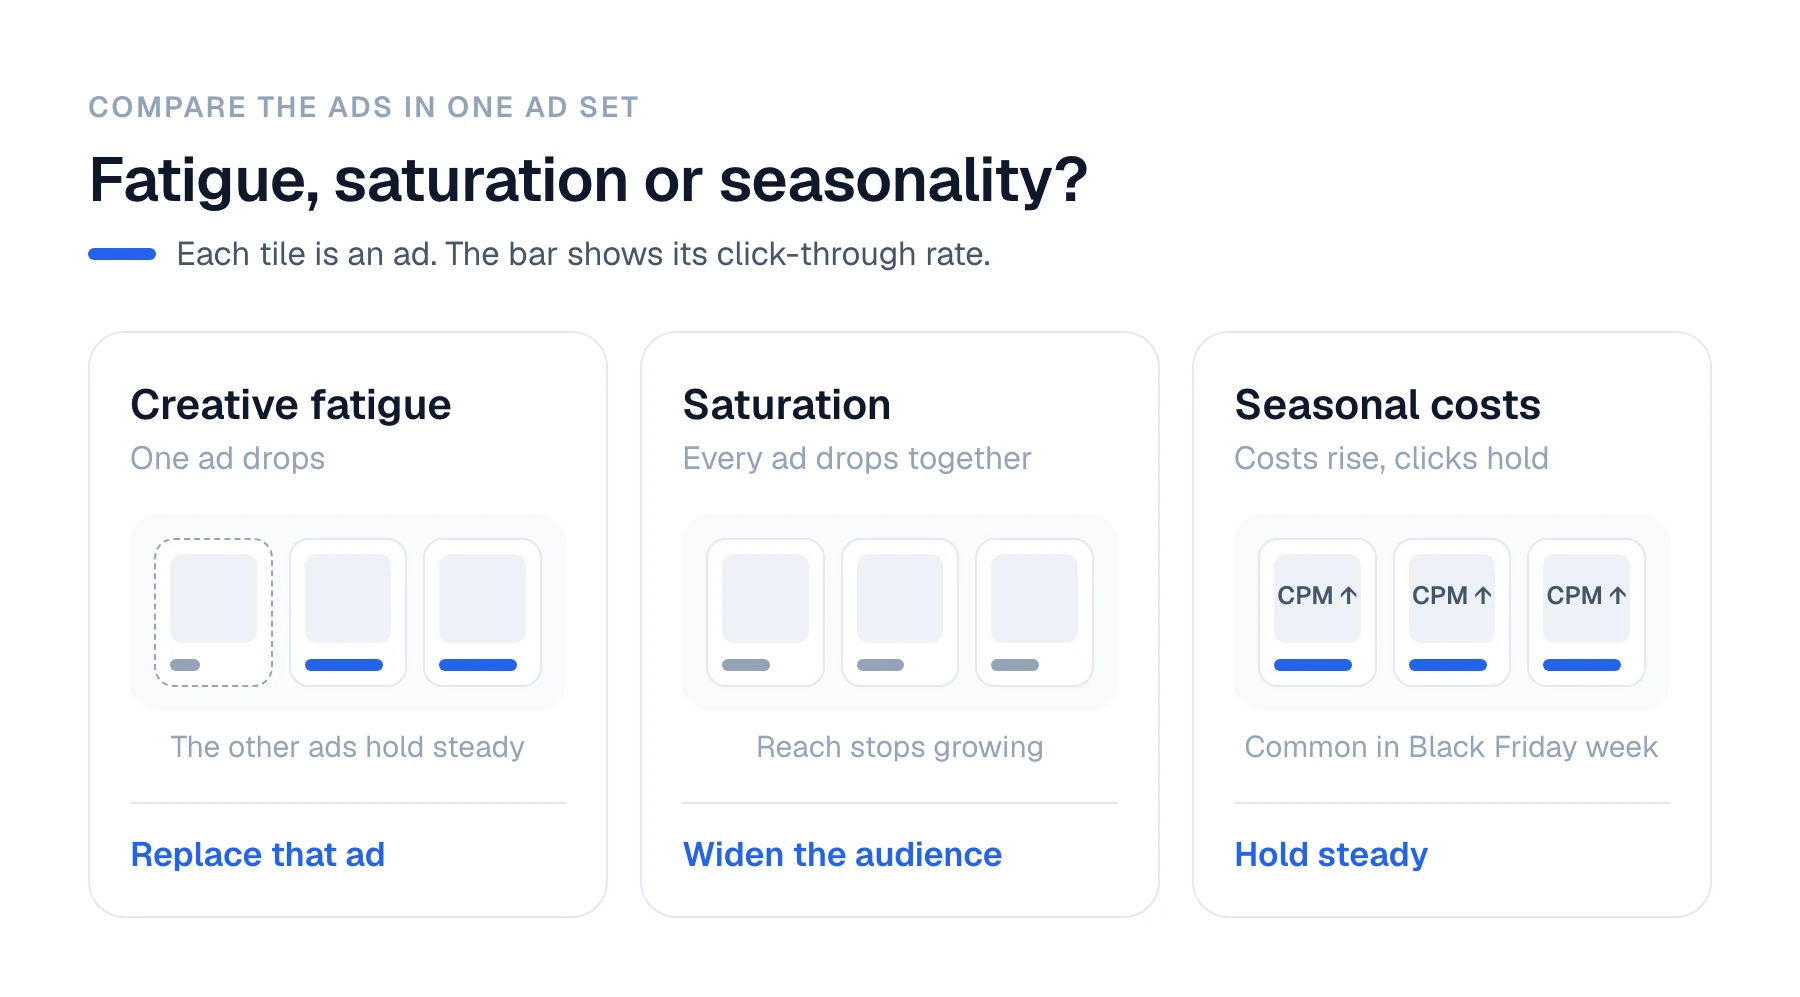
| What you see | Likely cause | What to do |
|---|---|---|
| One ad's frequency rises and its CTR falls, while other ads in the same ad set hold steady | Creative fatigue | Replace or refresh that ad. Keep the budget where it is. |
| Every ad in an ad set weakens at once, and reach has stopped growing even as spend rises | Audience saturation | Widen the audience, use broad targeting, or test a new interest or lookalike group. A new ad alone won't fix it. |
| CPM rises on every ad, including new ones, while CTR and conversion rate stay level or improve | Seasonal cost rise | Hold steady. Judge results on cost per purchase and Shopify orders, not CPM. |
Audiences can also overlap. If two of your ad sets target many of the same people, they bid against each other and push your CPM up. That looks like saturation, but the fix is to combine or separate the ad sets.
Ad Fatigue During Black Friday and Cyber Monday
November is the hardest month to read, because CPM rises for everyone. In 2025, Lebesgue found Meta CPMs among top spenders were 84% higher on Black Friday than in September, and the clear rise started in the week of November 10. Biddy measured a 57% rise against October for consumer brands. Lebesgue's category data put beauty and supplements at about 42% higher during Black Friday week.
Rising CPM in November is not a sign of fatigue on its own. Biddy also found that conversion rates rose so much on Black Friday that cost per purchase fell by 42%, even with CPMs that high. So during BFCM, judge an ad on its CTR, its frequency and its cost per purchase compared with your other ads in the same week.
Fatigue does get worse in November, because many brands run one sale creative hard for two or three weeks. If you plan to spend more around BFCM, have two or three new versions of your sale ad ready before the week of November 10. Then you can rotate them in as soon as frequency climbs, without waiting for a new shoot.
What to Do When You Find a Fatigued Ad
When an ad shows the week 3 pattern, change the creative before you touch the budget. In most cases these steps work, in this order:
- Add a new version of the same idea. Keep the offer and the angle that worked, and change the first three seconds of a video, the opening line, or the main image. This is usually enough when CTR has dropped by less than a third.
- Try a new angle if the idea itself is worn out. If two refreshed versions also fade within a week, people have heard the message. Test a different reason to buy, such as a result, an ingredient, a review, or a comparison.
- Pause the tired ad only when a replacement is running. Pausing it first can reset learning on the ad set and make the next week look worse than it is.
- Leave the budget alone until you know the cause. Cutting spend on a fatigued ad hides the problem. Raising spend on a saturated audience makes it worse.
If you decide budget does need to move between campaigns, our ad budget allocation template helps you compare campaigns on Shopify orders rather than on Meta's own numbers.
Frequently Asked Questions
What is ad fatigue on Meta?
Ad fatigue is when the people in your audience have seen the same ad so many times that they stop responding to it. Frequency rises, the click-through rate falls, and Meta charges more to show the ad. Cost per purchase rises and ROAS falls after that, usually one to three weeks later. The fix is a new or refreshed creative, not a smaller budget.
What frequency is too high for Meta ads?
For prospecting ads, a weekly frequency above about 2.5 is worth watching and above 3.5 often means fatigue, especially when the click-through rate is falling too. Retargeting ads can run at 4 to 6 before they weaken, because those people already know your store. Frequency alone is not proof. A high frequency with a steady click-through rate means the ad is still working.
How do I know if it is ad fatigue or audience saturation?
Compare the ads that run to the same audience. If only one ad is getting weaker, it is creative fatigue, and a new creative will fix it. If every ad in the ad set weakens at the same time and reach stops growing as you spend more, the audience is saturated. In that case, widen or change the audience, because a new ad alone will not help.
Why does ROAS drop last when an ad gets tired?
ROAS depends on purchases, and the people who still click a tired ad are usually the most interested ones. Their conversion rate can stay level for a while, so ROAS holds up even as fewer people click and each impression costs more. By the time ROAS falls, frequency, click-through rate and CPM have usually been moving the wrong way for one to three weeks.
Do Meta CPMs go up during Black Friday?
Yes. In 2025, Meta CPMs for top spenders were about 84% higher on Black Friday than in September, and the rise started around the week of November 10. Conversion rates also rise during those weeks, so cost per purchase can fall even with higher CPMs. Judge each ad on click-through rate, frequency and cost per purchase compared with your other ads that week.
What to Do This Week
Add frequency, link CTR, CPM, reach and cost per purchase to a saved column view in Ads Manager, and compare each active ad with its own first two weeks. Replace any prospecting ad where frequency is above 2.5 and CTR is down more than 20%, before ROAS shows the problem. If you plan to spend more in November, get two or three new versions of your sale ad ready before the week of November 10.
Daymark puts your Meta, Google and Shopify numbers in one place and explains what changed each week and why, including which ads are wearing out. You can see how it works on our page about comparing ad spend with real Shopify orders, or start a 14-day free trial and check your own ads before BFCM.
About the author

Co-Founder, Daymark
Karan is a co-founder of Daymark, where he builds the connections between Shopify, ad platforms, and warehouses that turn scattered store data into one source of profit truth. He writes about Shopify analytics, data integration, and using AI to query store data without SQL.
LinkedIn