




The reason is spread out
Traffic in GA4. Spend in ads. Orders in Shopify.
When a metric moves, trace it to the exact channel, page, product, or segment behind it. No more digging through reports.
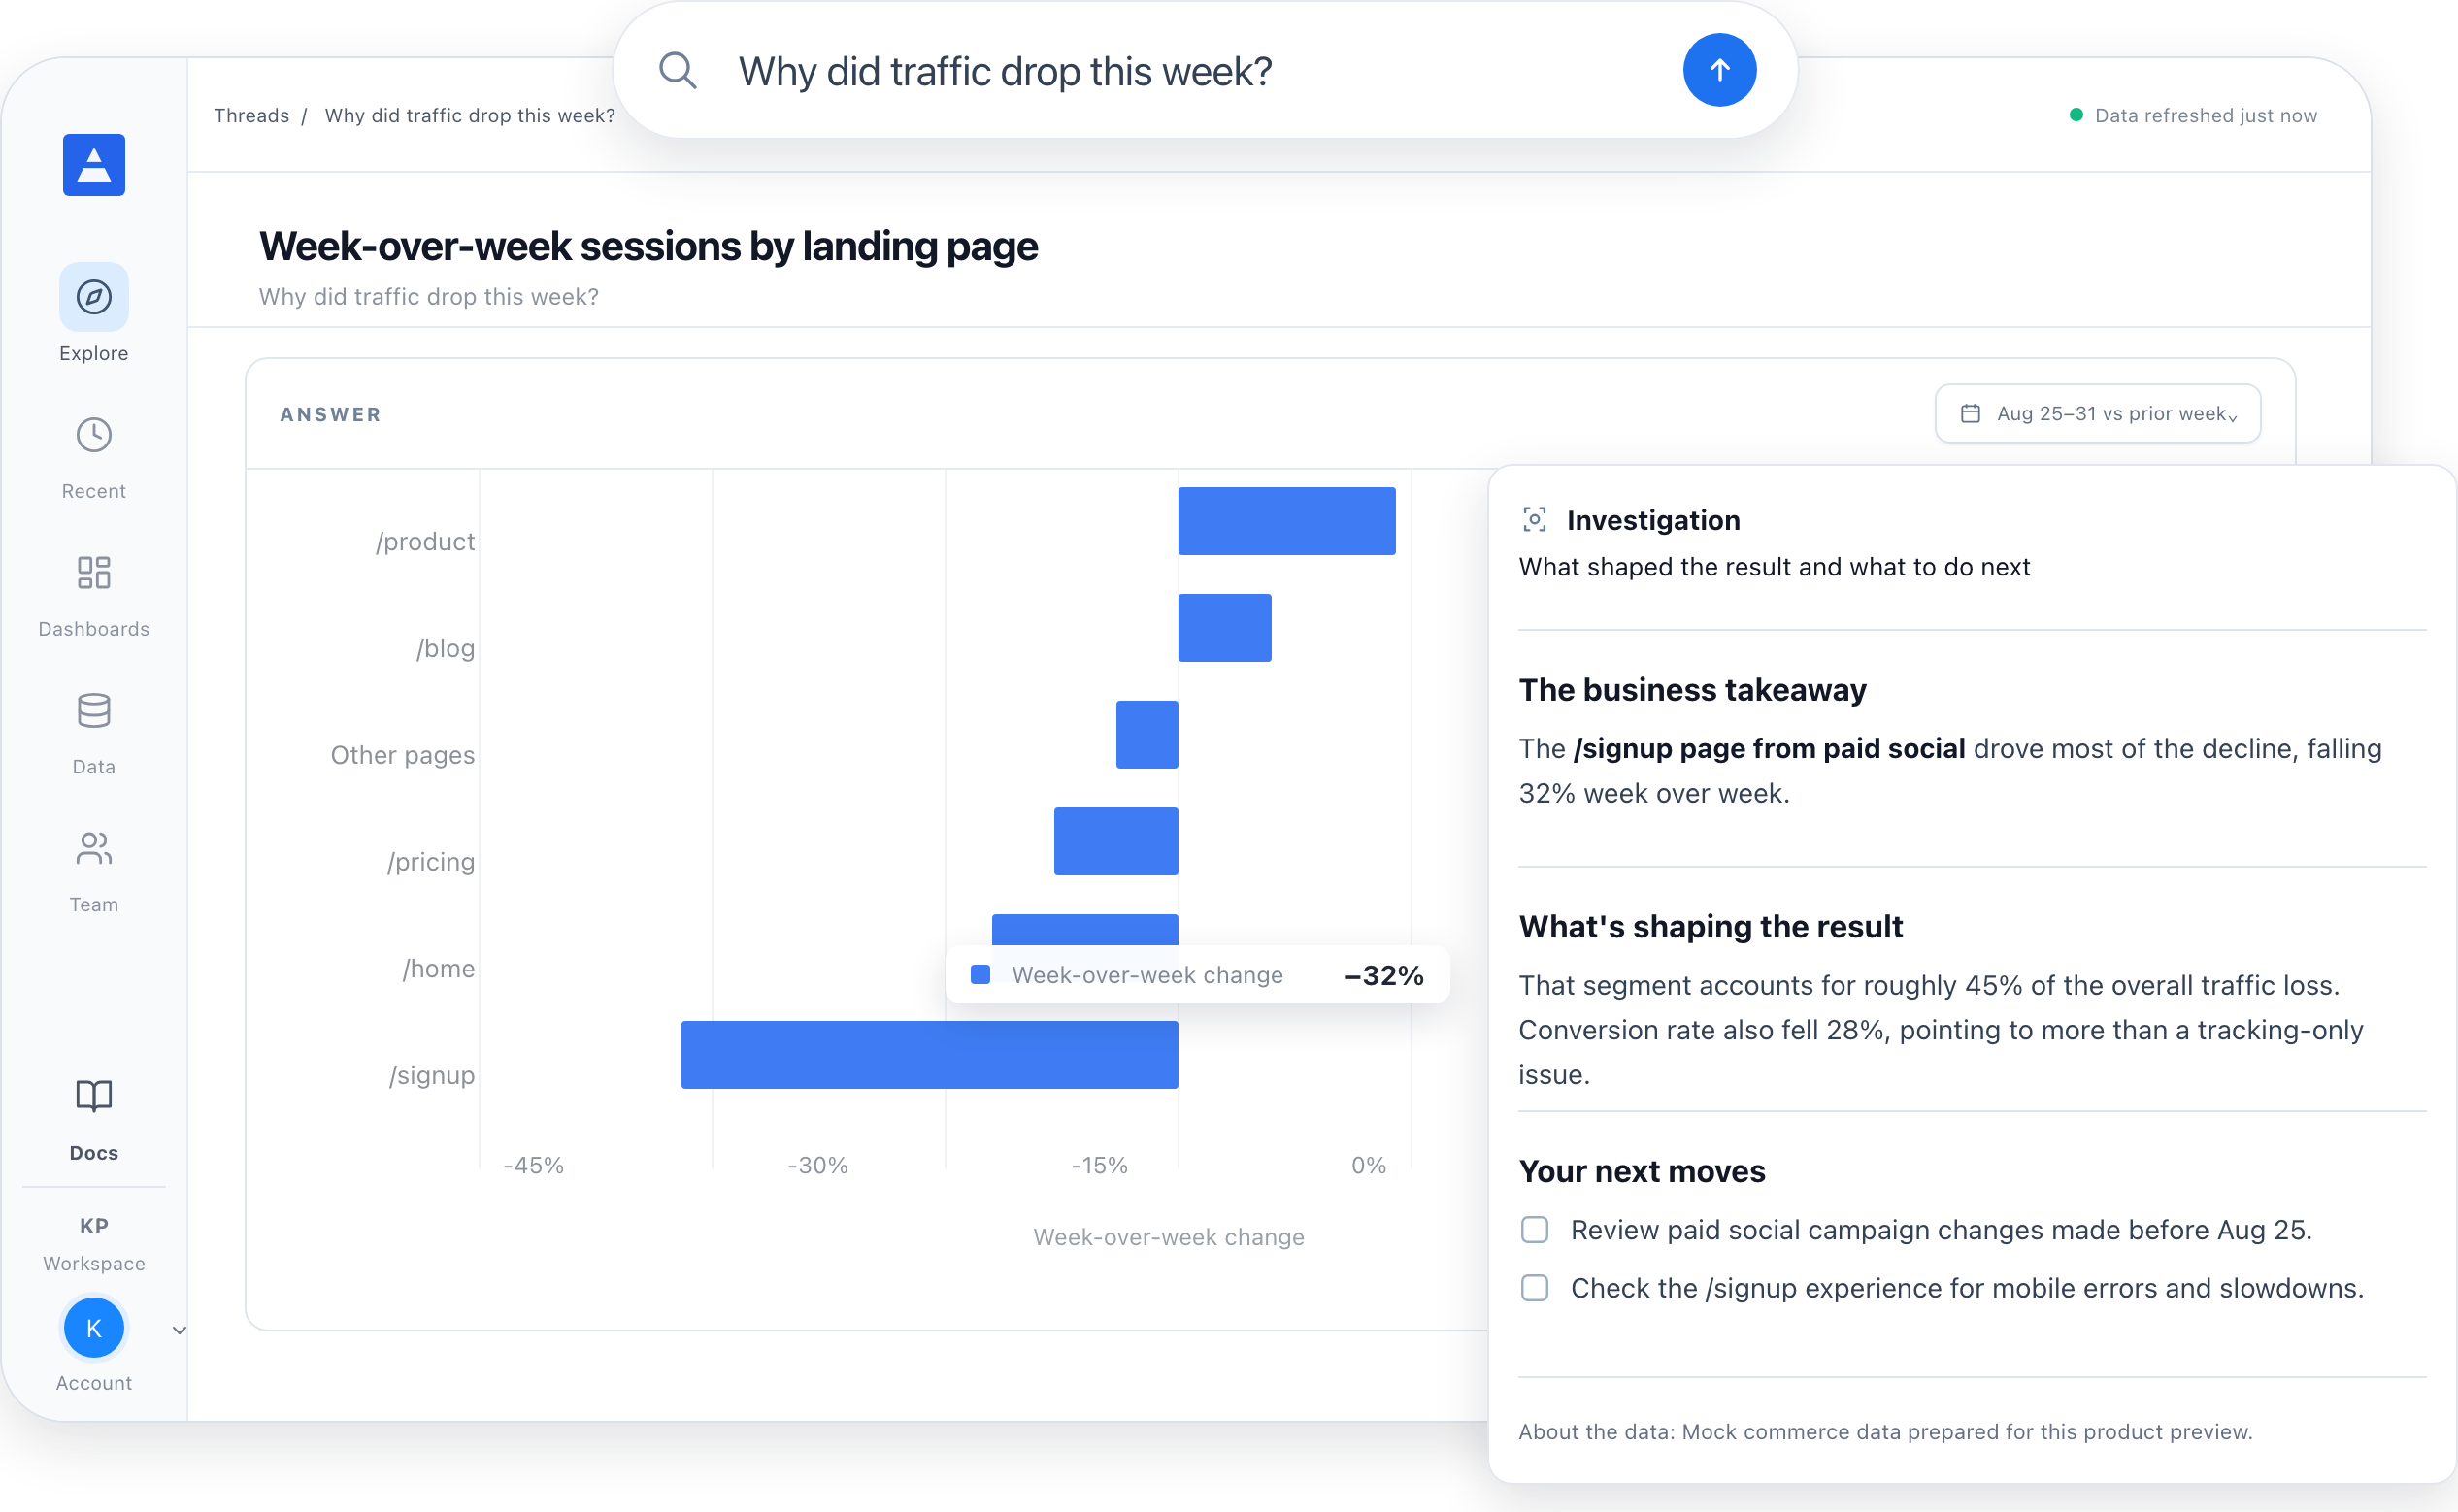
Orders fell. Was it traffic, conversion, or a product? Finding out takes hours.
Traffic in GA4. Spend in ads. Orders in Shopify.
One channel grows, another falls. The total barely moves.
One bad week can look like a trend.
Every insight leads to action. Every recommendation comes with the reasoning. And every step is visible, so you stay in control.
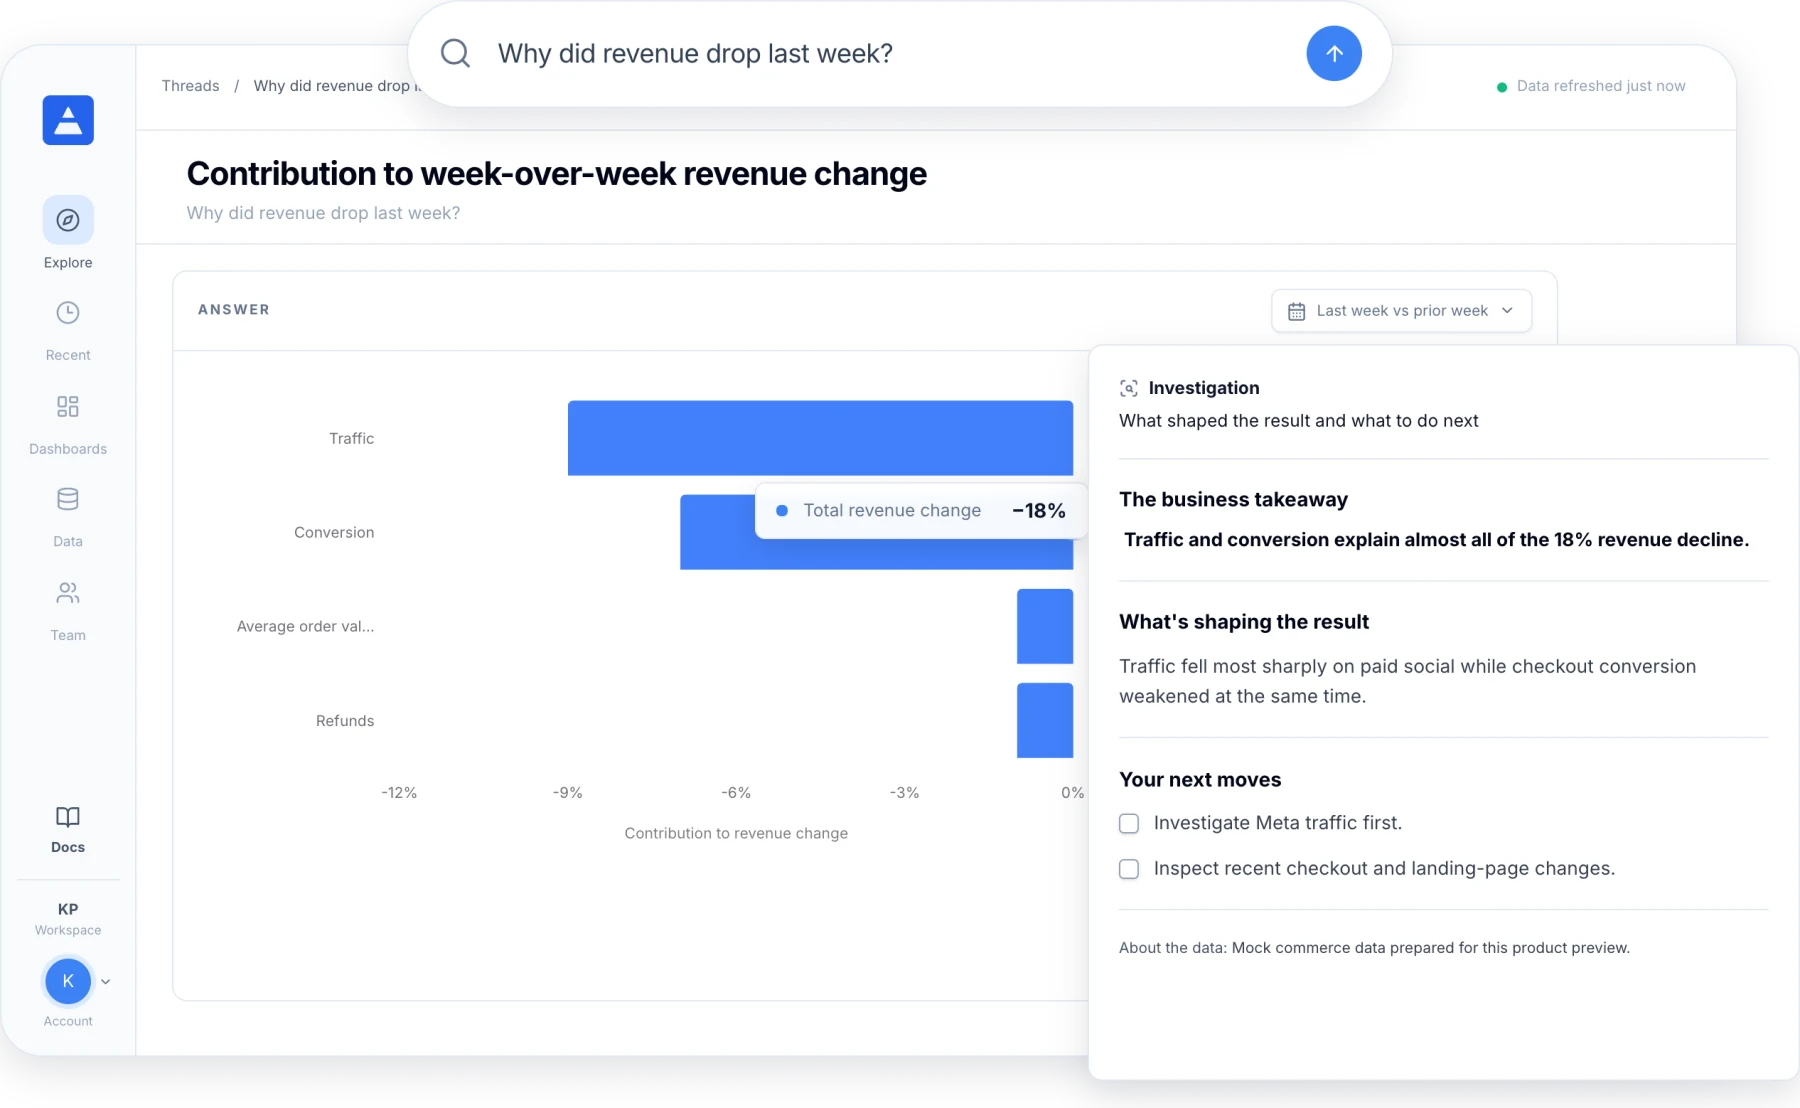
Was it traffic, conversion, AOV, or refunds? Know which lever moved.
“Why did revenue drop last week?”
“Was it traffic or conversion?”
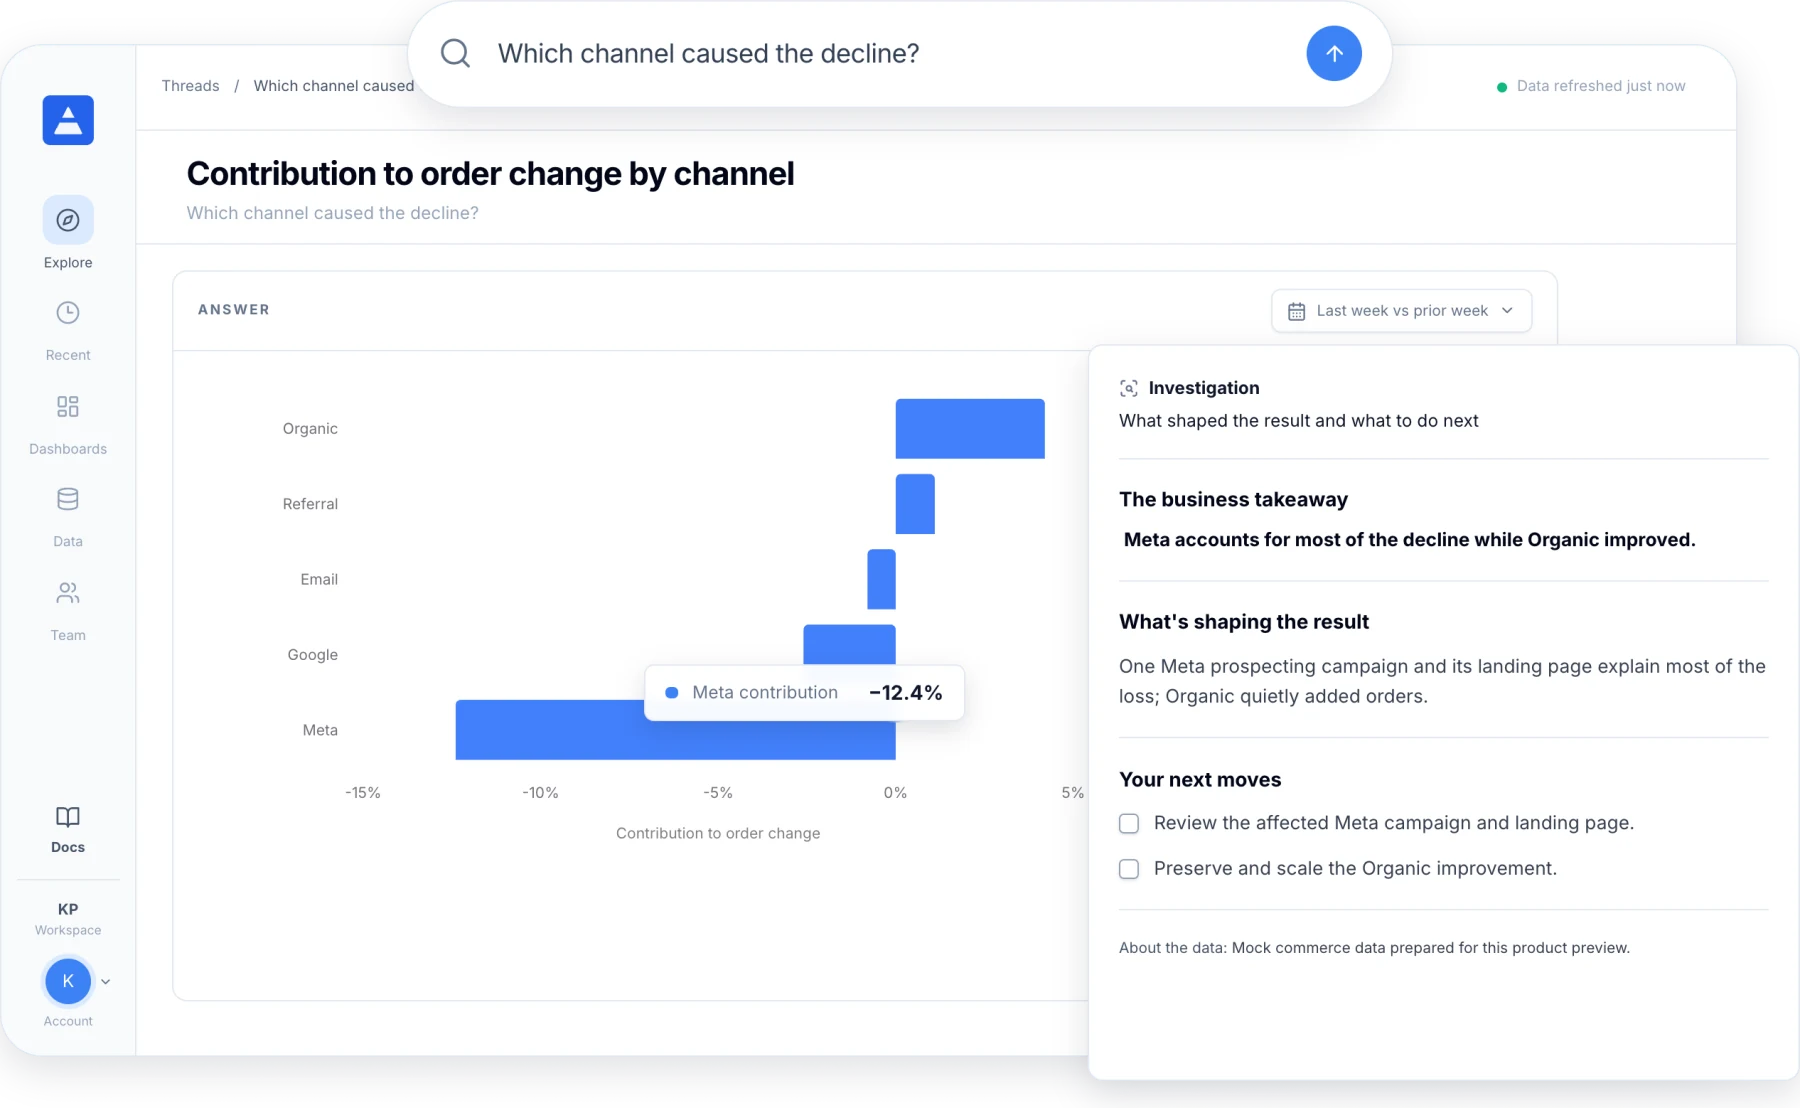
Find the exact channel, page, product, or region behind the change.
“Which channel caused the decline?”
“Which landing page lost the most sales?”
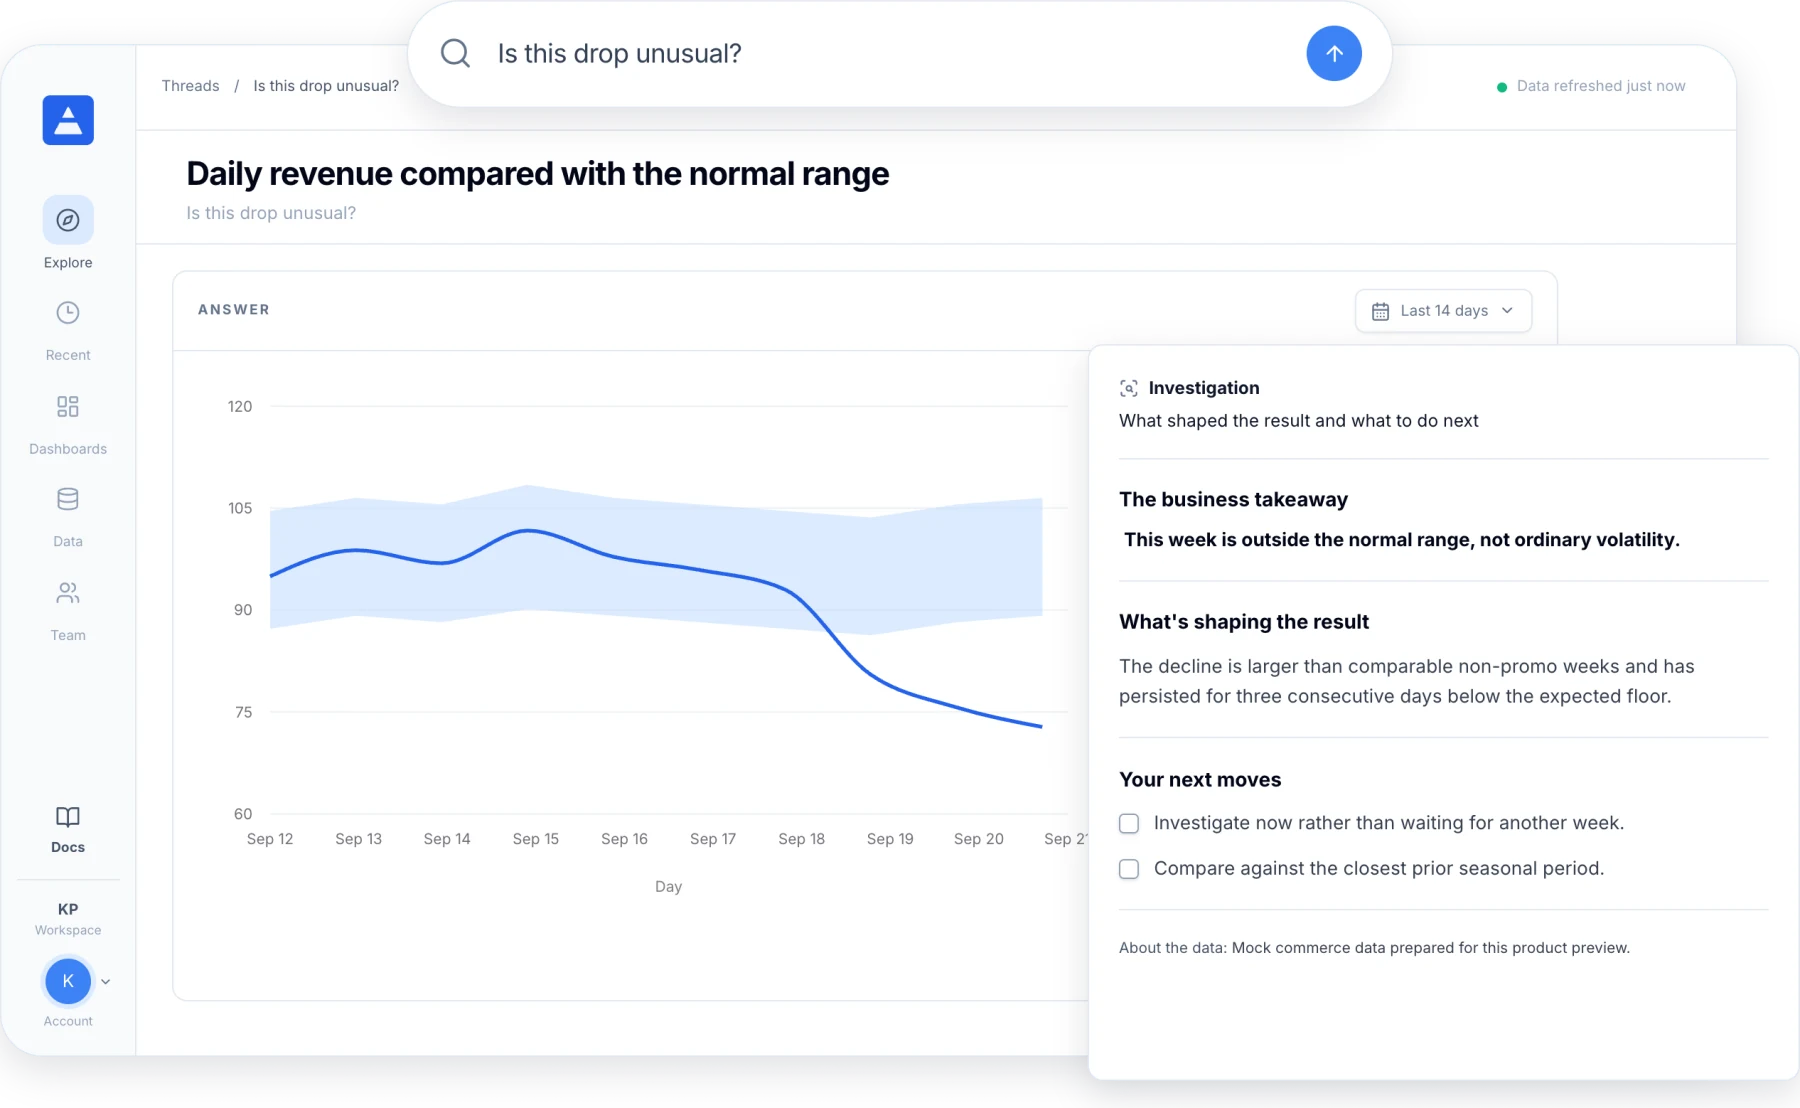
Compare against past weeks, promos, and seasons. Know if it's worth acting on.
“Why did AOV change this month?”
“Is this drop normal for this time of year?”
In minutes. Just ask.
Shopify to start. Add GA4 and your ad accounts for the full picture.
No. Your weekly report flags what changed and why, every Monday.
Connect your data and ask. Get the answer in minutes.