Understand what drives growth with Google Analytics data
Google Analytics has the data, but turning traffic and conversion numbers into clear insights takes time. Connect Google Analytics to Daymark to explore performance and publish dashboards your team can share.
Analytics is detailed, but hard to summarize
Too many views
Channels, pages, events, and segments are hard to connect in one report.
Numbers can differ
Attribution and settings can lead to different totals across tools.
Reports are not reusable
Findings often live in slides and screenshots, not dashboards.
How Daymark works with Google Analytics
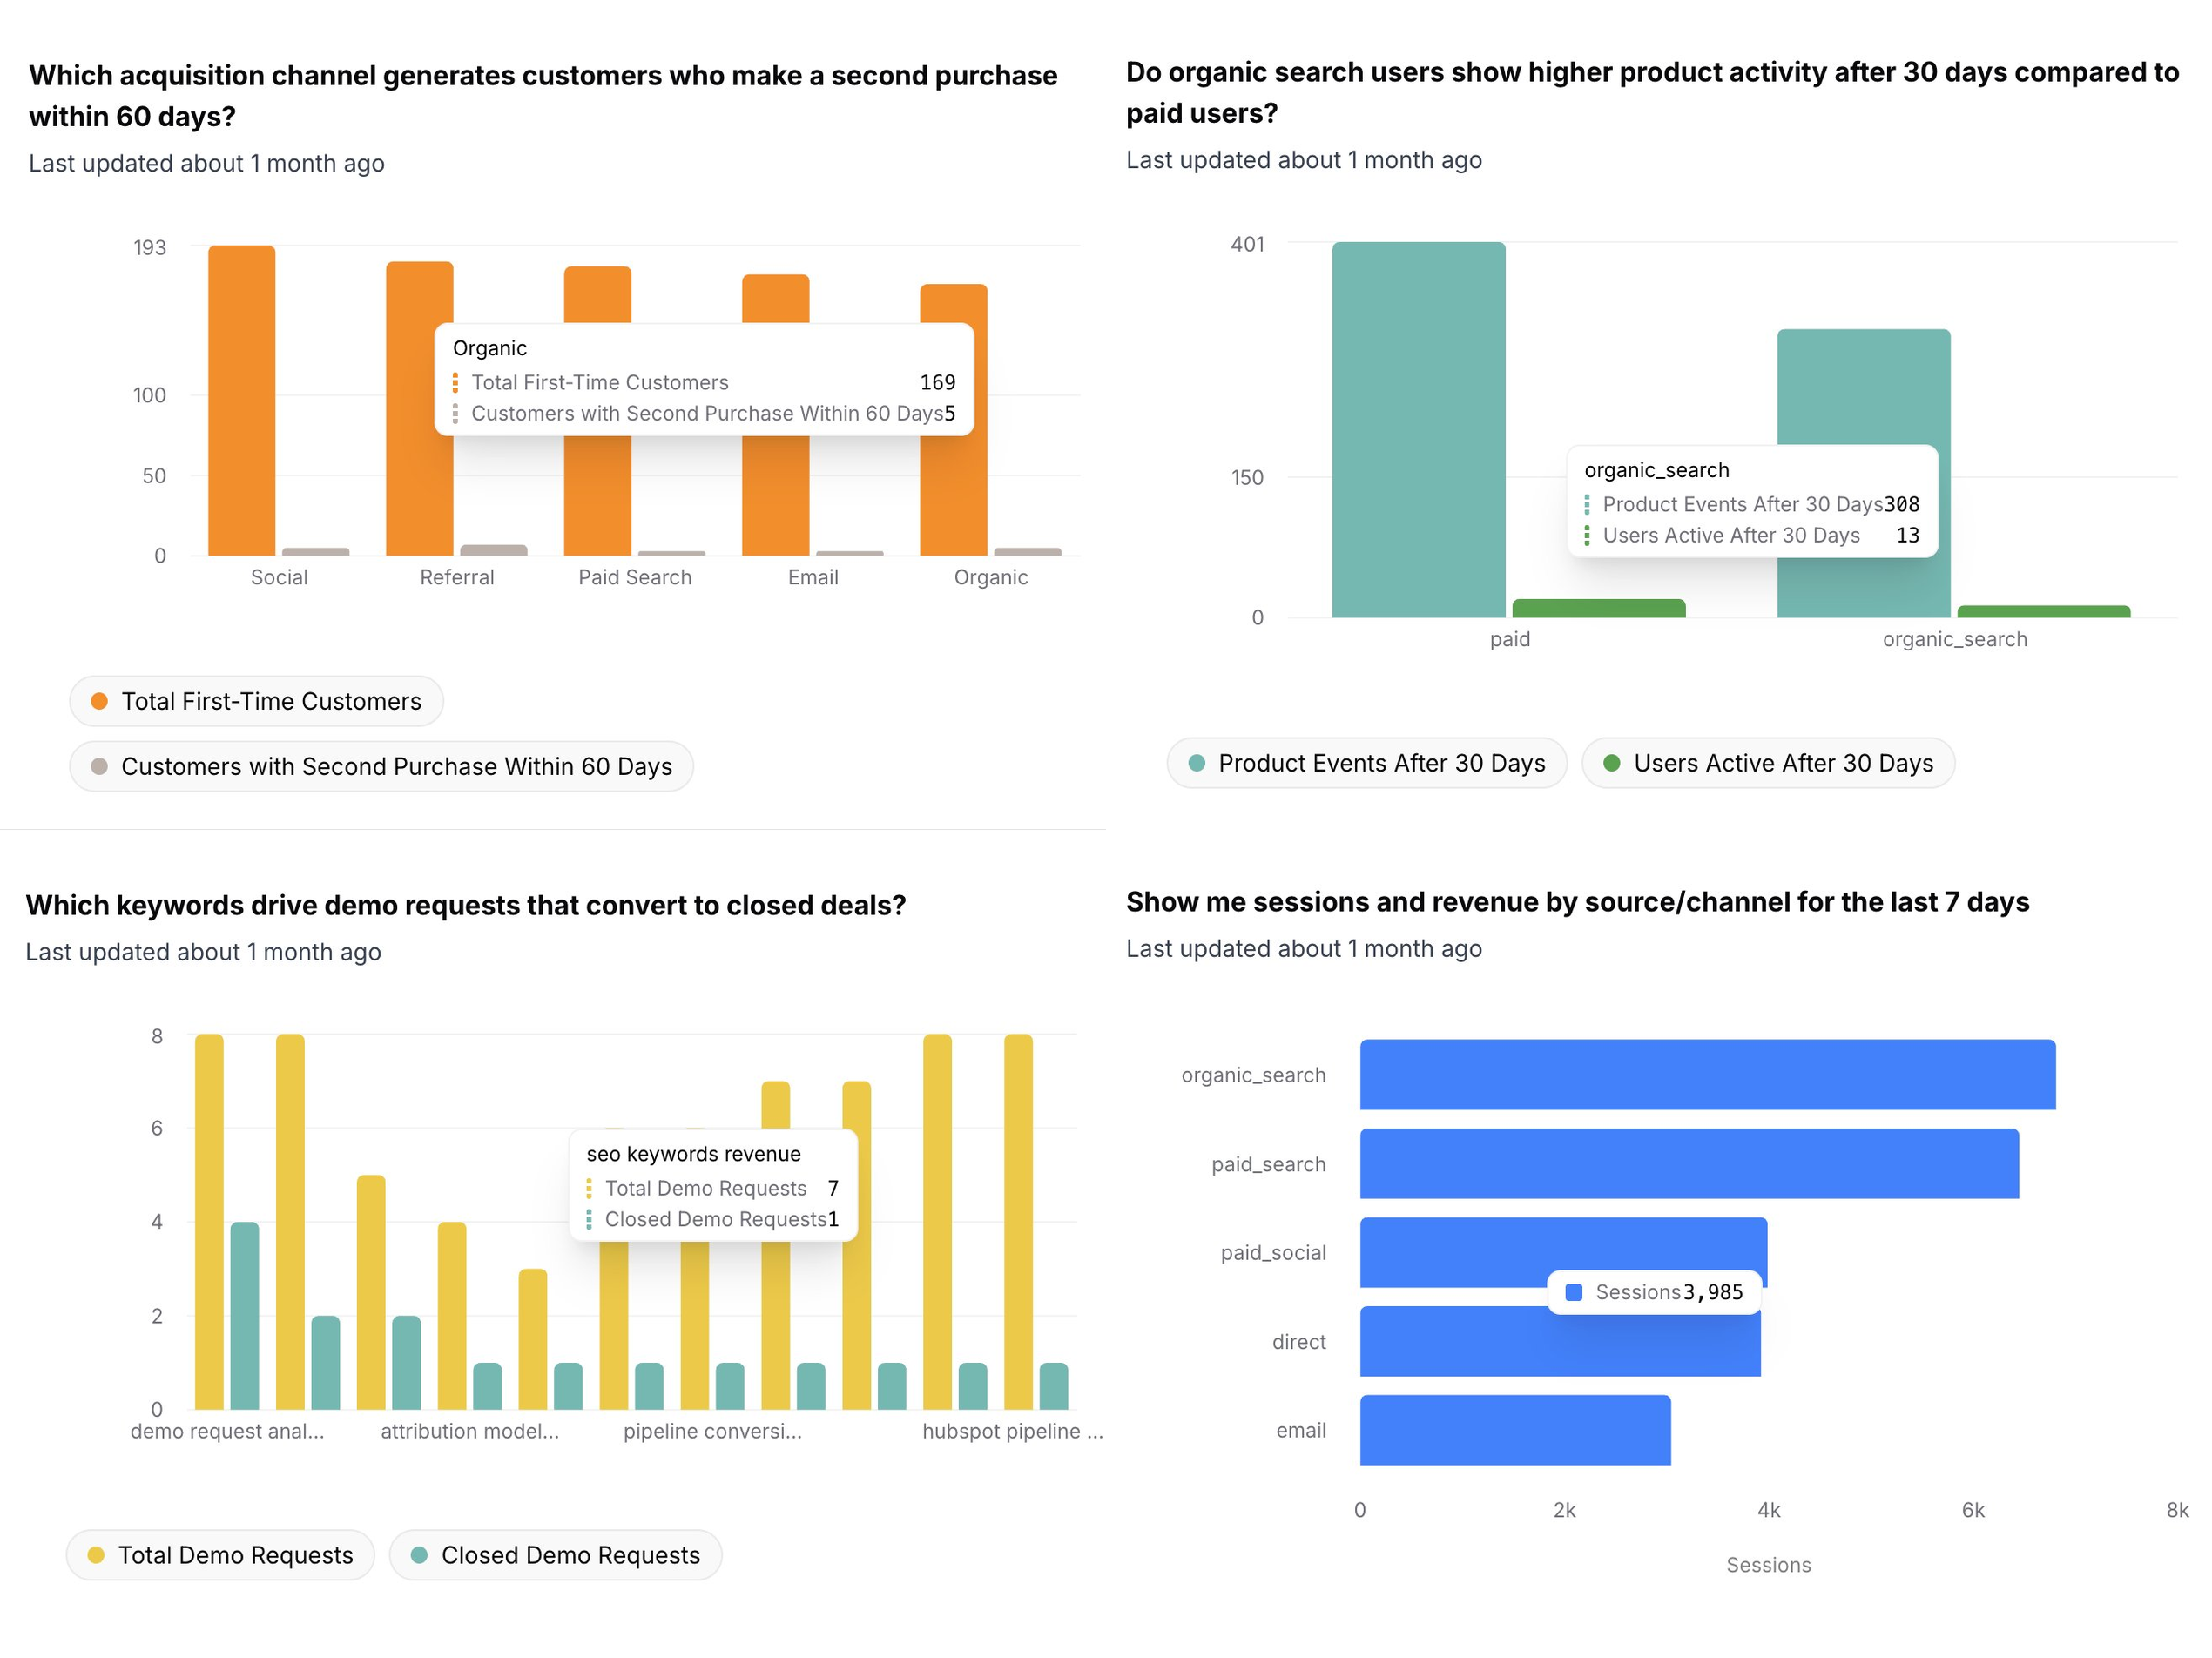
Turn analytics data into clear dashboards
Connect Google Analytics, ask what changed and why, then save the key charts to dashboards. This helps the team review results without rebuilding reports each time.
Connect Google Analytics
Sign in with OAuth and connect an account and property with read-only access.
Ask a question
Ask about traffic, conversions, channels, and pages to get visual answers.
Build a dashboard
Save and share dashboards for growth reviews and recurring reporting.
An AI workspace for trustworthy metrics
Ask questions in plain English, use data from multiple sources, and save answers as dashboards your team can share. No SQL required.
Ask questions and get clear answers
Ask a question and Daymark returns a chart, table, or summary that answers it. Save the result when it is useful.
Use multiple data sources in one place
Bring key metrics from tools like HubSpot, Ads, Analytics, Sheets, and Postgres into one workspace.
Dashboards your team can share
Save answers to dashboards so your team can review the same metrics. Share dashboards for weekly updates, planning, and reviews.
Your data stays yours
Daymark is built for teams that handle sensitive business data. Read-only access, minimum permissions, and AI that never trains on your data.
Access
Read-only access with least privilege
Daymark uses the minimum scopes required for every integration and never writes to your production systems. All connectors are read-only by design.
- Read-only connectors
- No production writes
- Scoped database access
AI safeguards
Built for safe AI analysis
Our AI agents work only with schema metadata and limited query results to generate insights. Your underlying data is never used to train models.
- No training on your data
- AI agents cannot modify your systems
Connect Google Analytics in Daymark
Start exploring your data with read-only access in minutes.