Why did I make less profit this week even though sales were up?
See what changed across discounts, shipping, ad spend, refunds, and product mix. You get the reason profit dropped, not just the number.
Connect Shopify and your ad accounts, then ask anything in plain English. Daymark gives you the answers your Shopify reports can't: true profit after discounts and returns, which ads bring repeat customers, and where ad spend is leaking.
14 days free · No credit card · No automatic charge · $100/month after trial
 Shopify
 Meta Ads
 Google Ads
 GA4
GA4Profit, ad spend, and repeat customers live in different tools. Daymark brings Shopify together with your ads and analytics, then answers the questions that need all of them at once.
Shopify shows you first orders. Daymark ranks every channel by who comes back, so you can spend on the customers who reorder instead of the ones who buy once.
Which channel brings customers who reorder within 60 days?
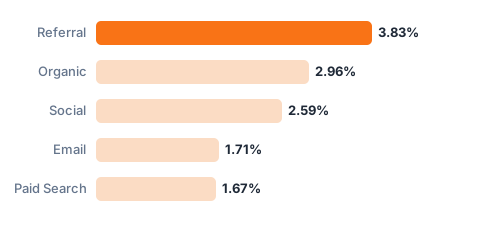
Referral drives 2.3× more repeat customers than Paid Search
Shopify × GA4 · 2,847 orders
Daymark compares spend against real Shopify revenue across your Meta and Google campaigns. It surfaces the audiences quietly returning the most on the smallest budget.
Which audience gets the highest ROAS but the smallest budget?
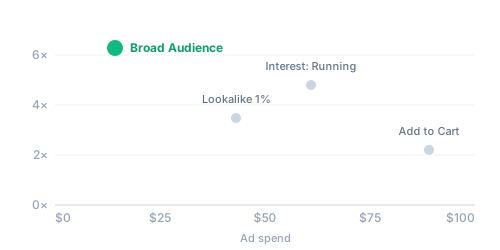
Broad Audience returns $6.30 per $1 on your smallest budget
Meta Ads · last 90 days
Your biggest market by order count is rarely your most valuable. Daymark ranks regions and segments by what they actually spend, so your budget follows the customers worth the most.
Which regions have the highest average order value?
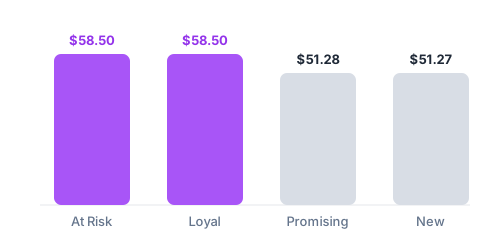
Mountain West averages $96/order, 39% above the region you spend most on
Shopify × GA4 · last 12 months
What Shopify owners ask
These are real questions from Shopify brands. Each one connects multiple sources and shows its work. No SQL, no exports.
See what changed across discounts, shipping, ad spend, refunds, and product mix. You get the reason profit dropped, not just the number.
Get true profit per product after discounts, returns, shipping, and fees. Scale the winners and fix the losers.
Spot the campaigns and audiences spending without profitable orders. Pause the waste and move budget to what works.
Compare channels and campaigns by repeat purchases, not just first orders. Invest in the ads that bring customers back.
Find the products driving refunds, and the reasons behind them. Reduce returns and protect your margin.
See the most common second-purchase paths. Build better bundles, post-purchase offers, and retention flows.
Not a black box. Daymark connects, reasons, and shows every step.
Shopify, Meta, Google Ads and GA4 in minutes. No pipeline, no migration.
+ moreAsk in plain English, or hand Daymark a goal. It hunts your data for the opportunity and what to try next.
Every answer ships with the summary, the chart, and the exact queries it ran.
Daymark brings Shopify, your marketing, and your spreadsheets together so you see the full story, not half the picture.
 PostgreSQL
 Google Sheets
 HubSpotGoogle AnalyticsGoogle AdsMeta Ads
 Google Search ConsoleShopifyPostgreSQLGoogle SheetsHubSpotGoogle AnalyticsGoogle AdsMeta AdsGoogle Search ConsoleShopify
No. Daymark connects directly to your Shopify store. You can start with read-only access and skip manual exports.
Most teams connect Shopify and get their first answer quickly. Setup usually takes about 10 minutes.
Yes. You can view Shopify profit with discounts and returns included so the numbers reflect what you actually keep.
Yes. If you connect your ad accounts, Daymark maps orders back to channels so you can compare repeat customer behavior.
That works. Start with Shopify first, then connect ads later when you are ready.
Access is read-only and permissioned. Only approved users in your workspace can view connected data.
Yes. Dashboards are easy to share with teammates or partners so everyone can work from the same view.
We walk through your current reporting flow, connect the right sources, and answer real store questions live.
Connect Shopify read-only. Ask anything. Get the answer and the reasoning behind it. Try everything free for 14 days.
14 days free · No credit card · No automatic charge · $100/month after trial