Weekly Business Health Check for Founders and Operators
A single Monday-morning dashboard that gives founders and operators a complete, cross-source view of business performance from the previous week.
Overview
Running a business means context-switching between Shopify, Google Analytics, and your ads platforms every Monday morning to piece together last week's story. This template is built to replace that ritual entirely — one dashboard that surfaces the complete picture across revenue, traffic, acquisition, and ad efficiency in a single view.
Designed for founders and operators who need signal, not noise, this weekly business performance dashboard combines Shopify revenue and order data with Google Analytics traffic and Google Ads and Meta Ads spend data. It answers the five questions every operator asks at the start of the week, and surfaces any anomalies worth investigating before they become problems.
Weekly KPIs monitored across all channels:
- Revenue vs prior week — top-line performance with day-by-day comparison
- Sessions and conversion rate — traffic volume and quality vs last week
- Ad spend and blended ROAS — total marketing spend efficiency across all paid channels
- New vs returning customer orders — acquisition vs retention balance
- Top traffic sources — which channels drove volume and revenue this week
You'll be able to answer:
- Did revenue go up or down this week, and why?
- Is traffic growing and converting at the same rate as last week?
- Are we spending ad budget efficiently across Google and Meta?
- Is there any metric I need to dig into this week before it becomes a bigger problem?
Questions In This Template
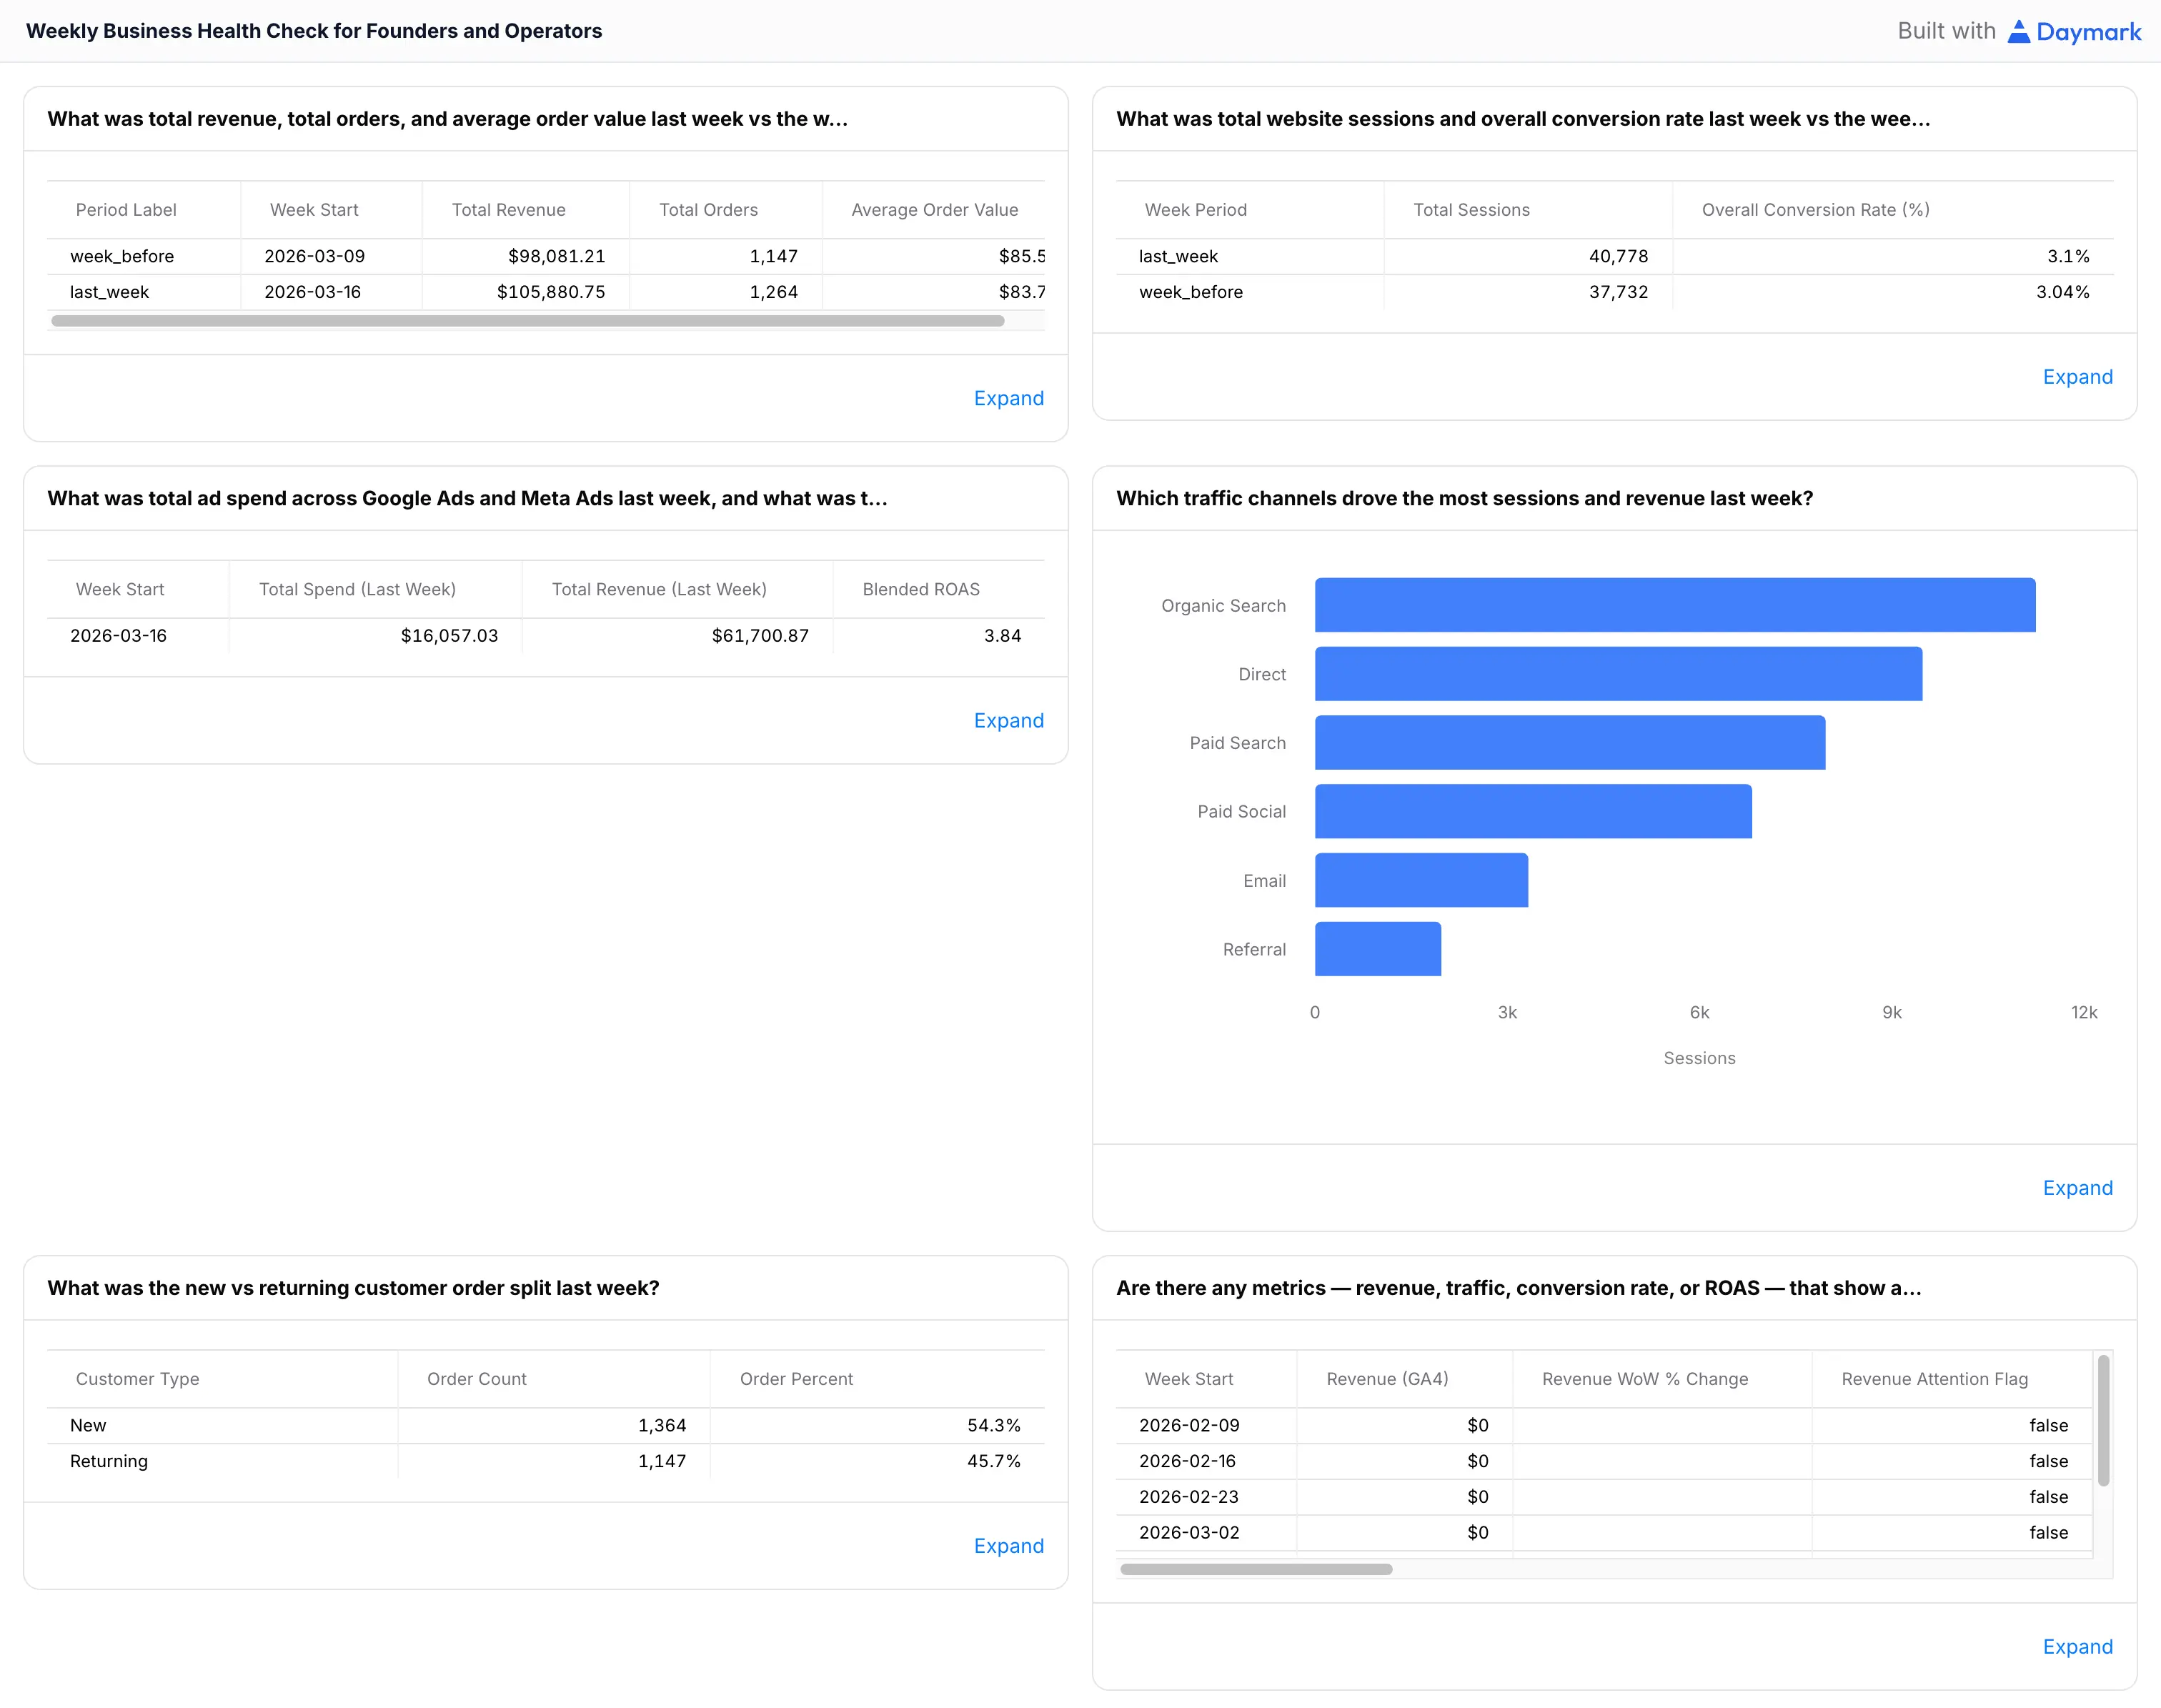
Q1. What was total revenue, total orders, and average order value last week vs the week before?
Q2. What was total website sessions and overall conversion rate last week vs the week before?
Q3. What was total ad spend across Google Ads and Meta Ads last week, and what was the blended ROAS?
Q4. Which traffic channels drove the most sessions and revenue last week?
Q5. What was the new vs returning customer order split last week?
Q6. Are there any metrics — revenue, traffic, conversion rate, or ROAS — that show a significant week-over-week change requiring attention?