Fix Your Ecommerce Checkout Funnel and Recover Lost Revenue
Identify exactly where shoppers are abandoning your checkout process and quantify the revenue impact of each drop-off point.
Overview
Cart abandonment costs ecommerce stores billions every year — yet most teams only track the headline abandonment rate without knowing where in the funnel shoppers actually leave. This template maps the full checkout journey from product page view to completed purchase, so you can find the specific step losing the most revenue and fix it with confidence.
By combining Shopify transaction and order data with Google Analytics behavioural funnel data, you get both the revenue impact and the user behaviour signals in the same dashboard — turning a vague metric into a clear, actionable diagnosis.
Ecommerce funnel metrics tracked:
- Cart abandonment rate — sessions that added to cart but didn't reach checkout
- Checkout abandonment rate — sessions that began checkout but didn't complete purchase
- Step-by-step funnel drop-off — product view → add to cart → checkout initiated → payment → purchase
- Revenue lost to abandonment — estimated revenue of abandoned carts by day and channel
- Conversion rate by device and traffic source — where your funnel underperforms by segment
You'll be able to answer:
- At which checkout step are we losing the most potential customers?
- How much revenue are we leaving on the table from cart and checkout abandonment?
- Do mobile users drop off at a different stage than desktop users?
- Which traffic channels send visitors who are most likely to complete a purchase?
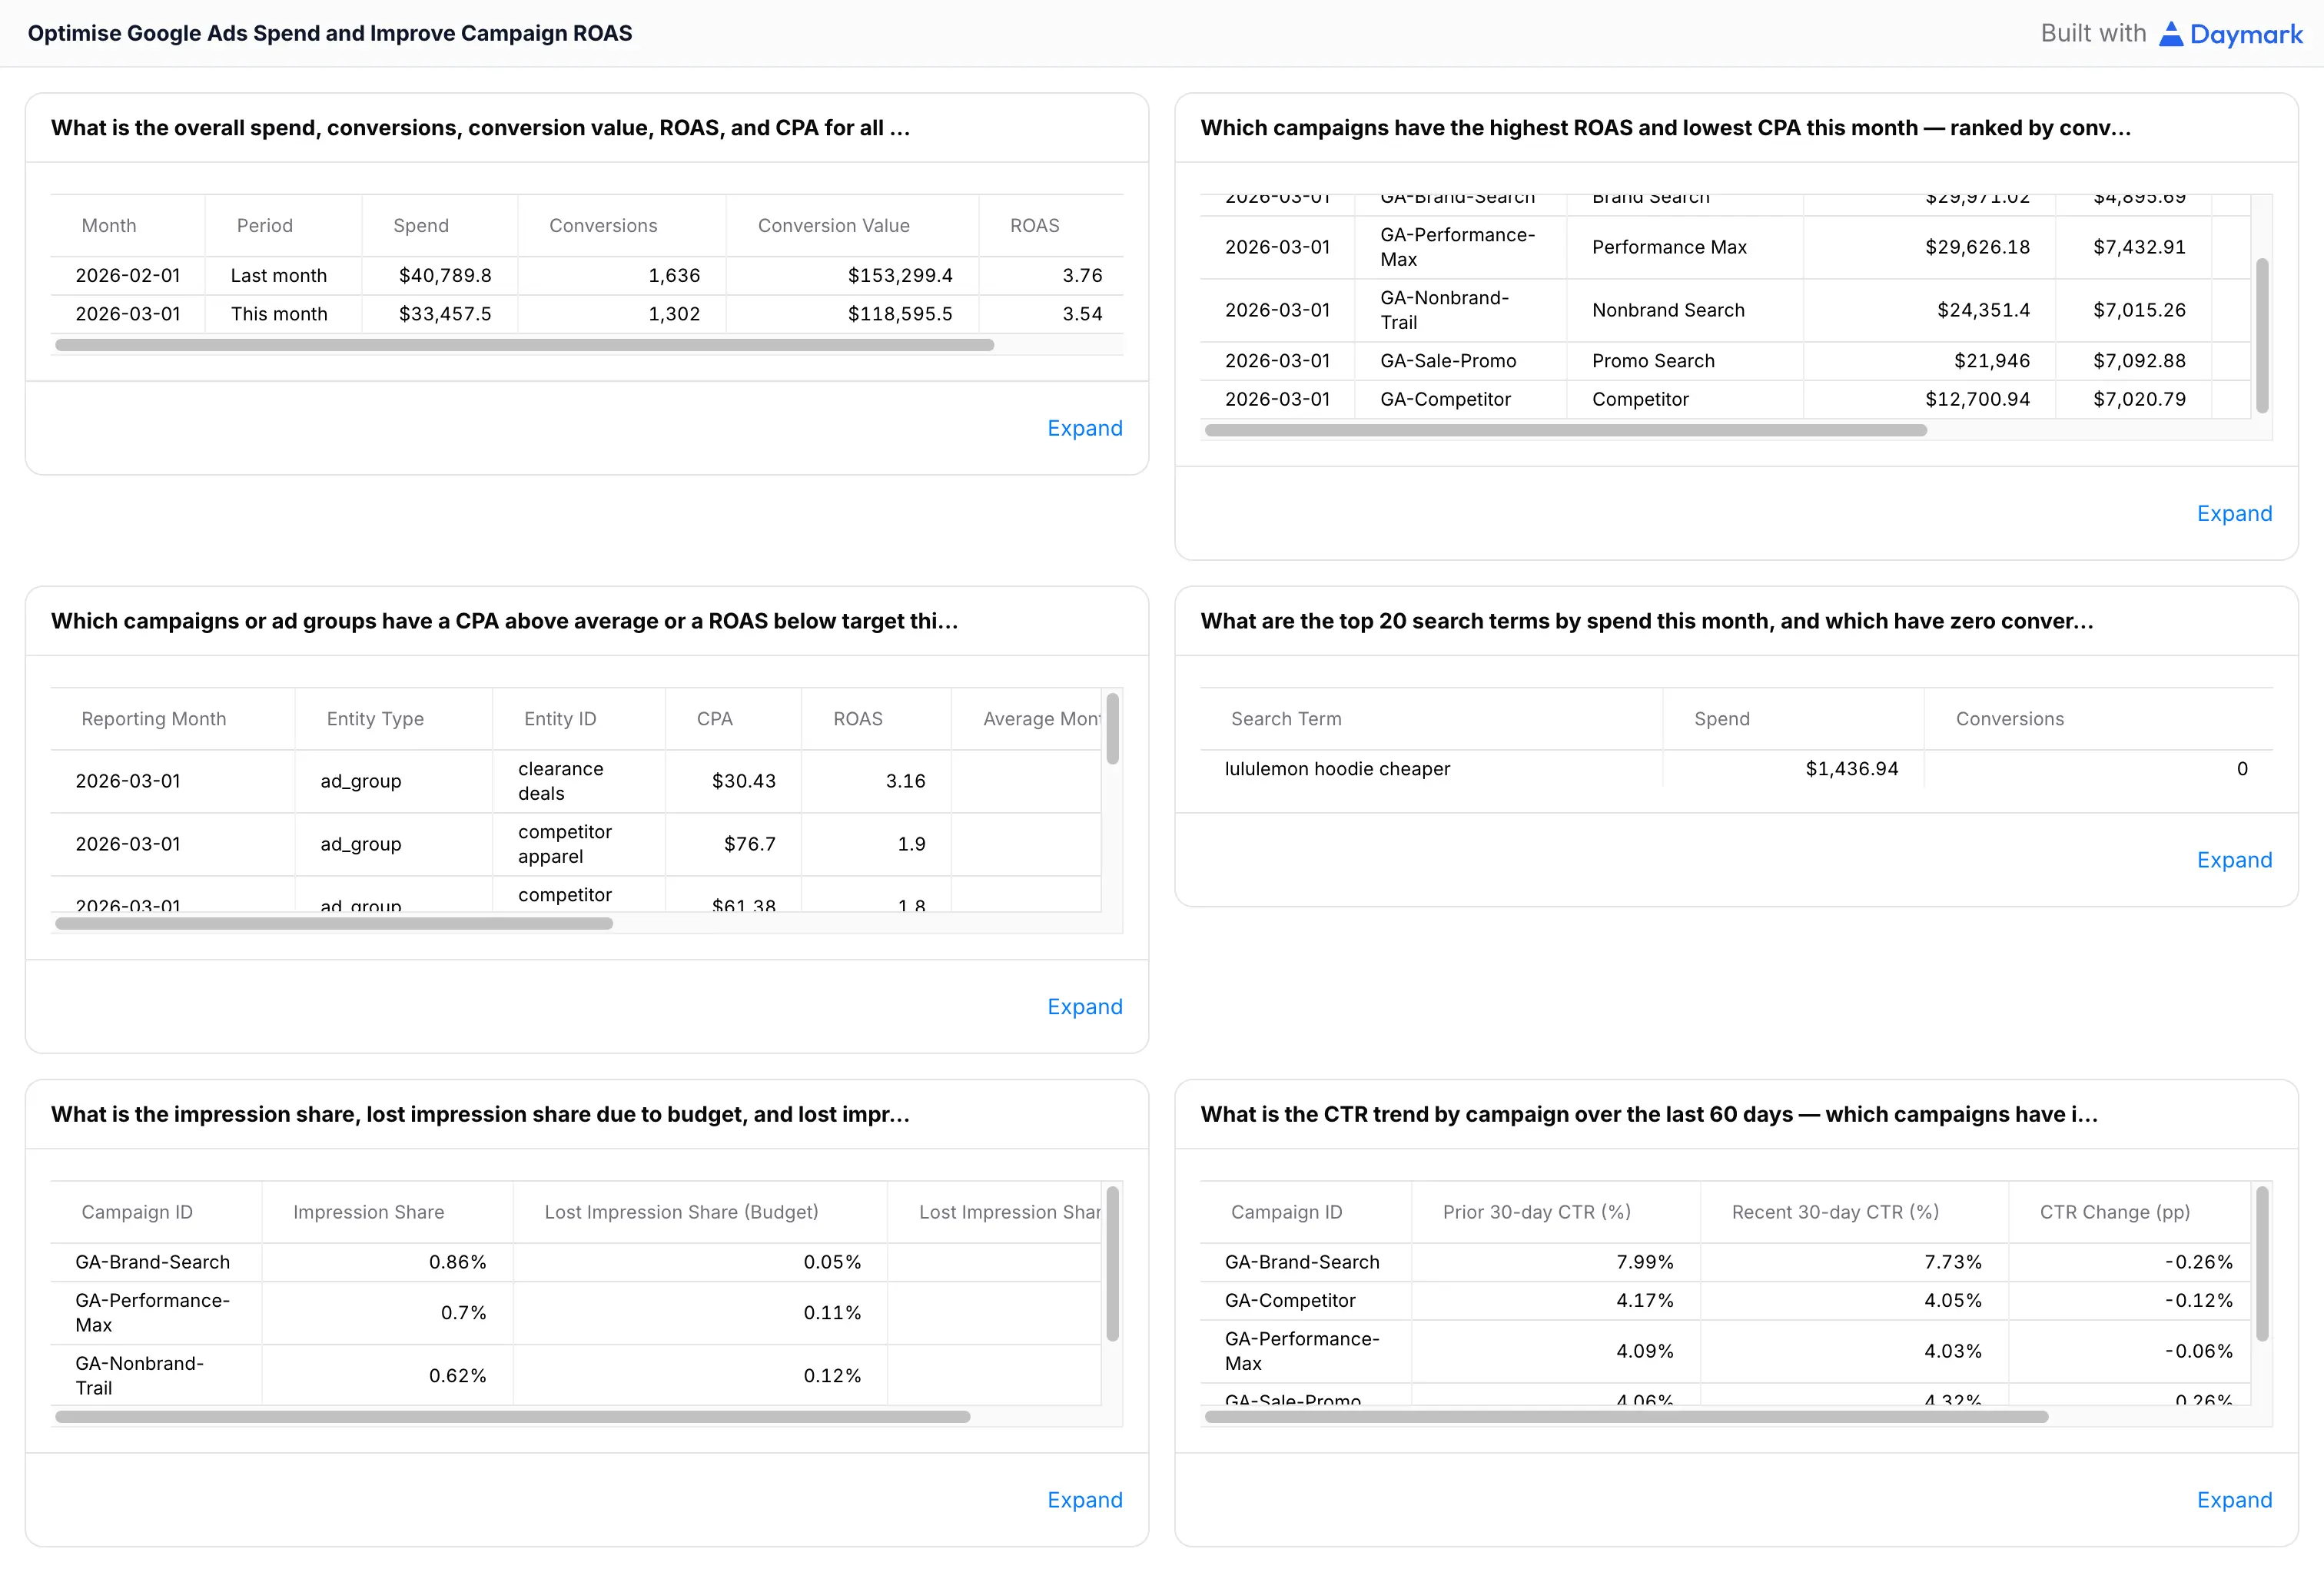
Questions In This Template
Q1. What is the step-by-step funnel conversion rate from product page view through to completed purchase over the last 30 days?
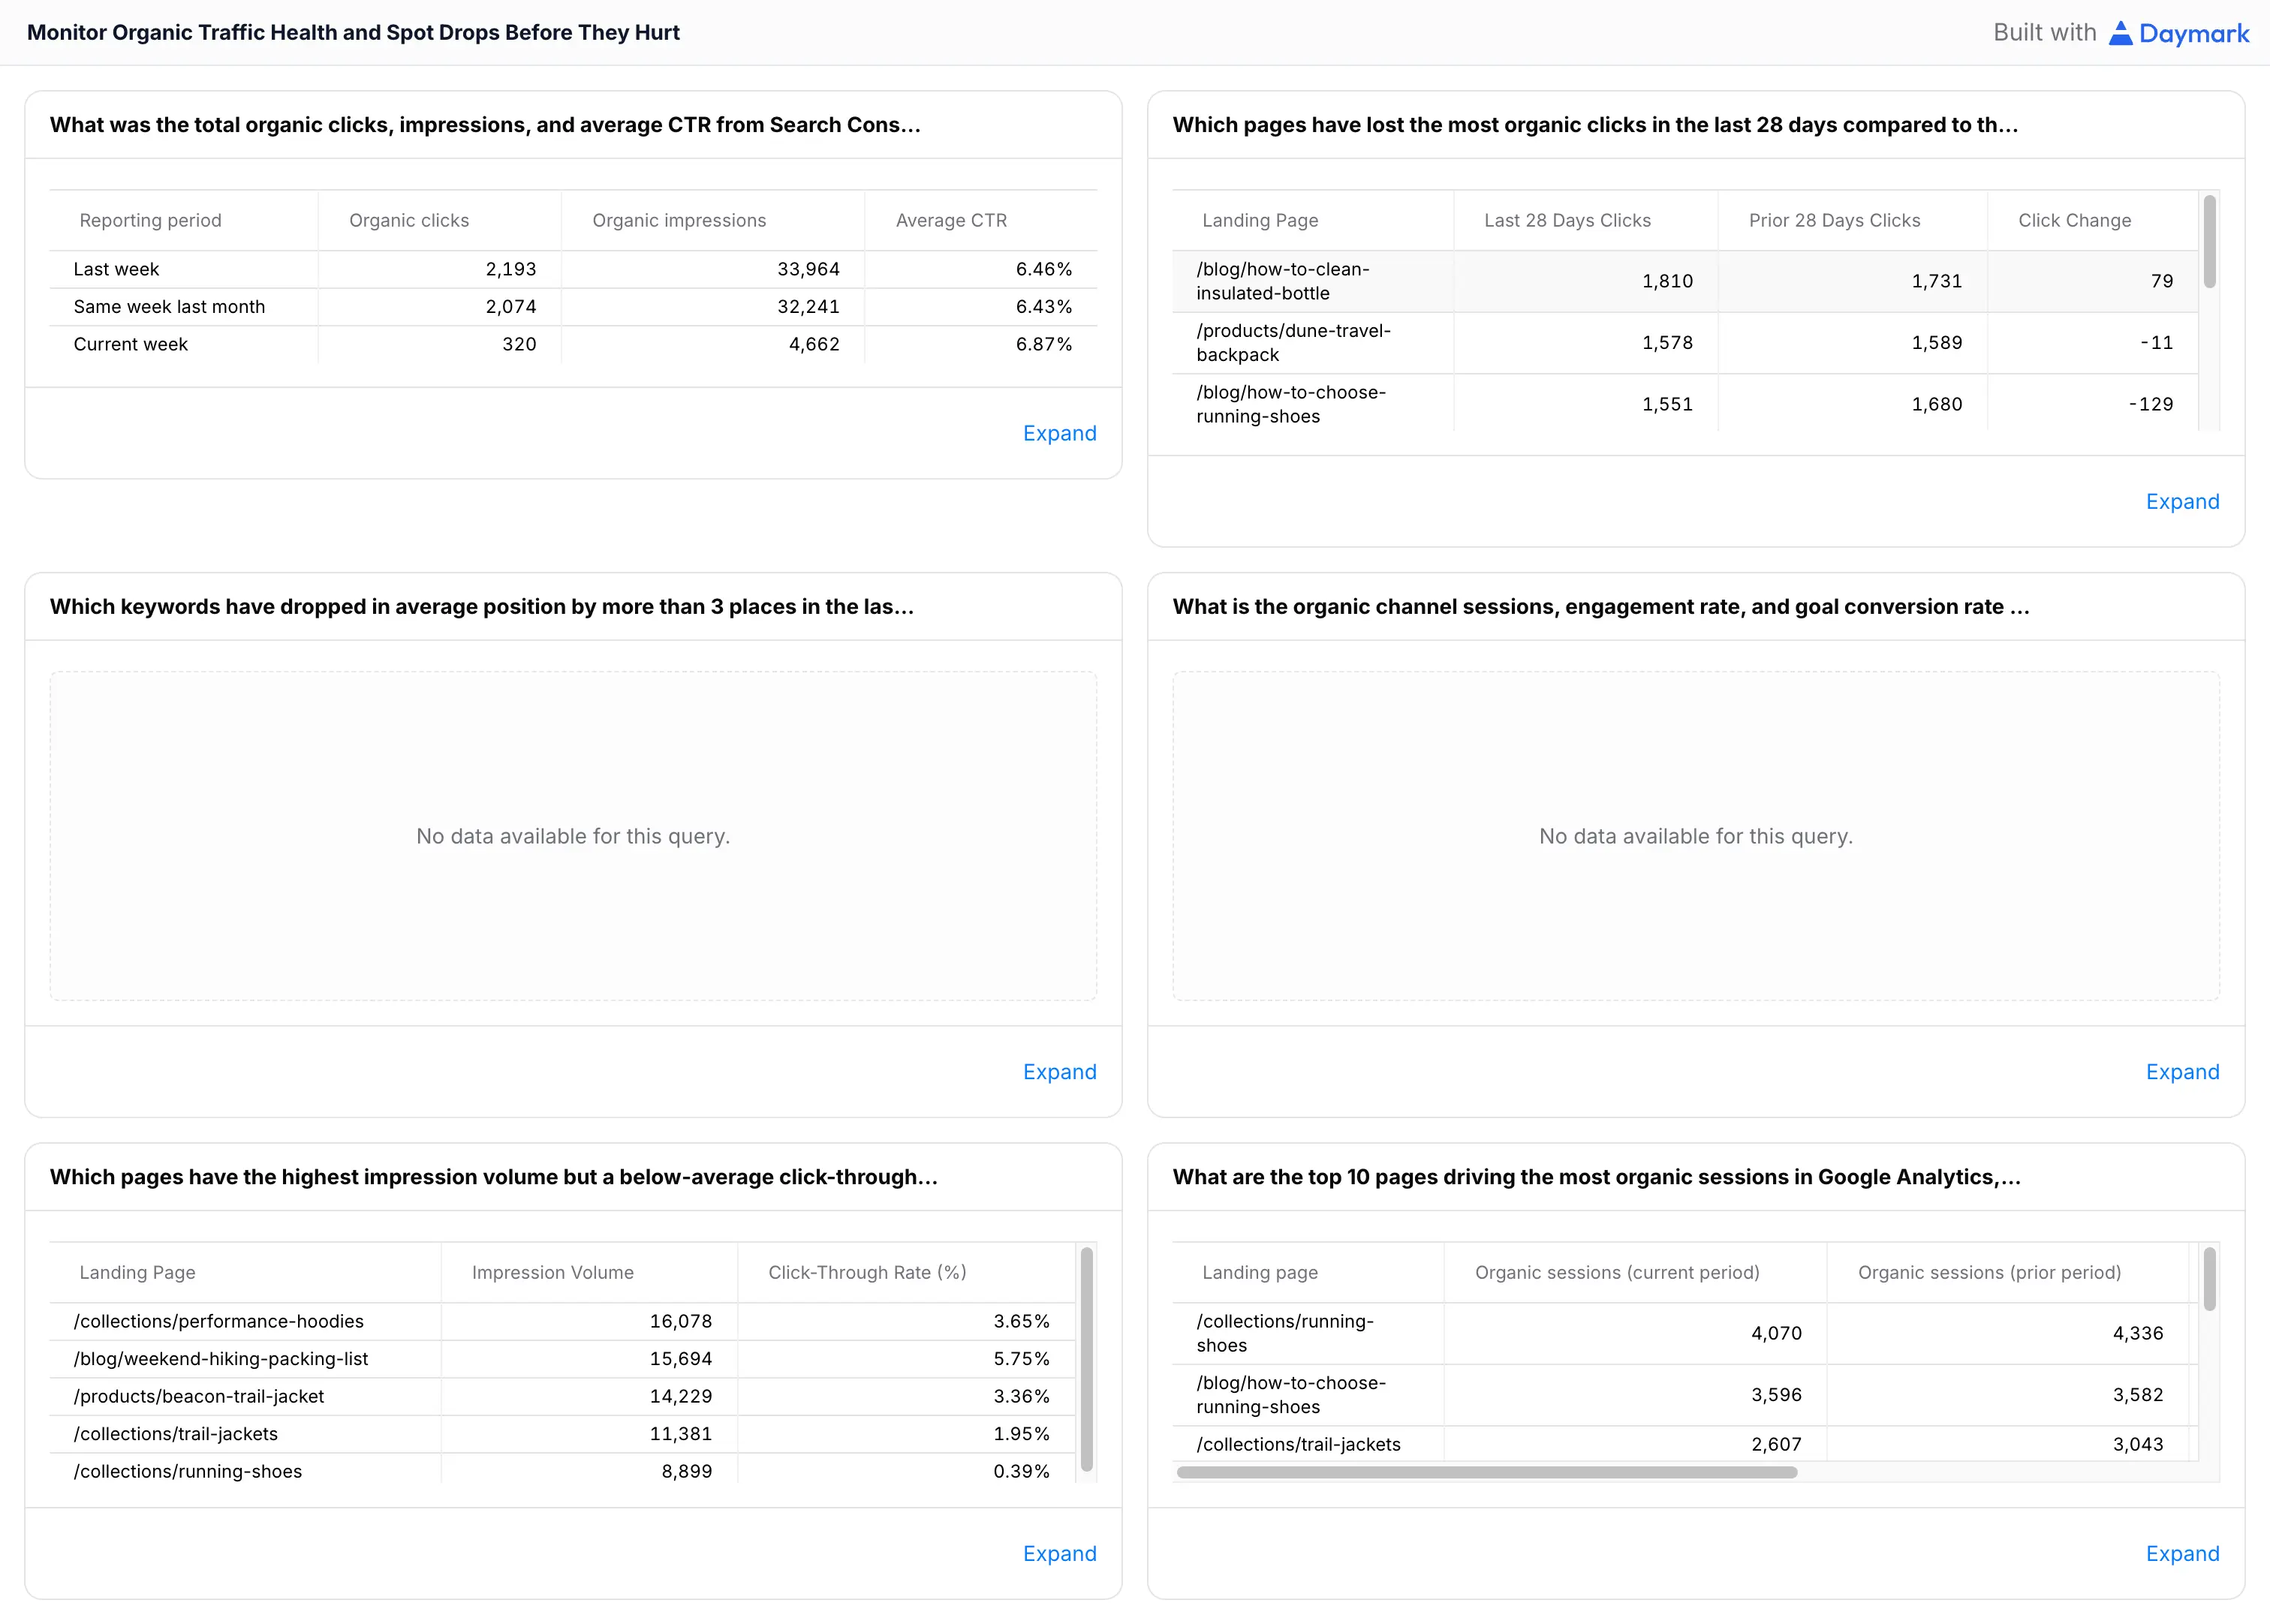
Q2. What is the cart abandonment rate and checkout abandonment rate this month vs last month?
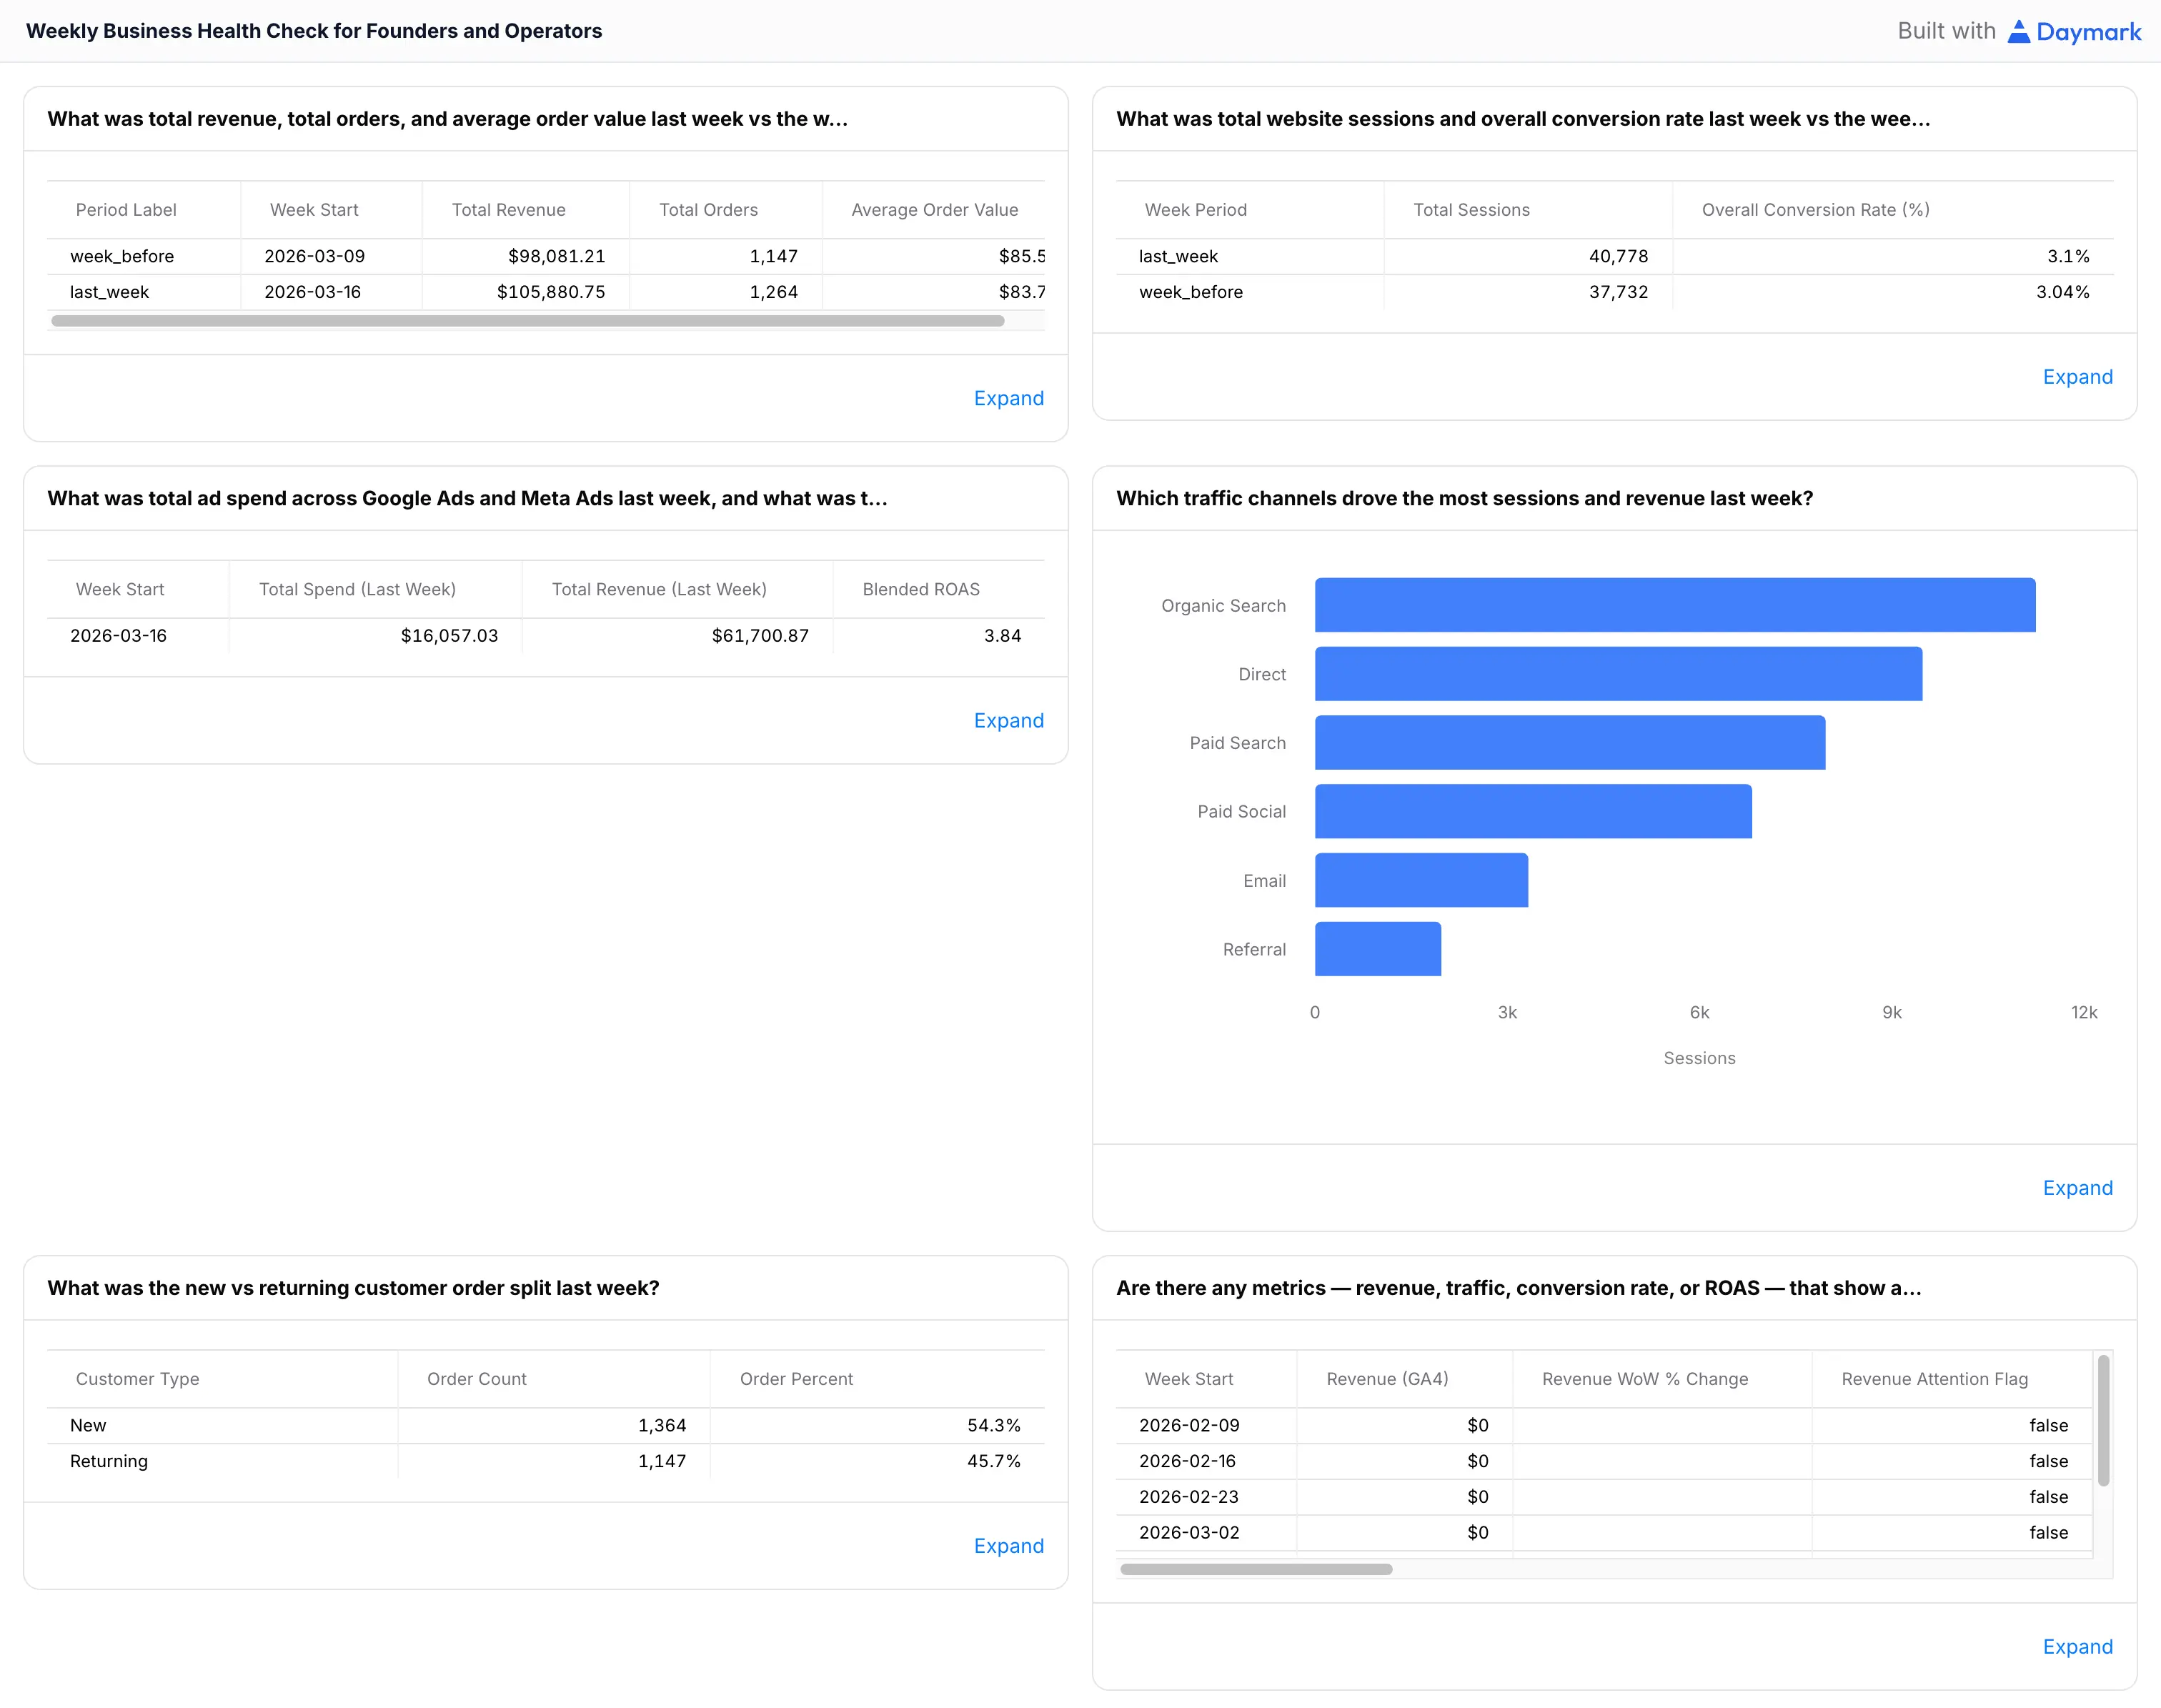
Q3. What is the estimated revenue lost to cart abandonment this month, broken down by day?
Q4. What is the purchase conversion rate broken down by device type (mobile vs desktop vs tablet) over the last 30 days?
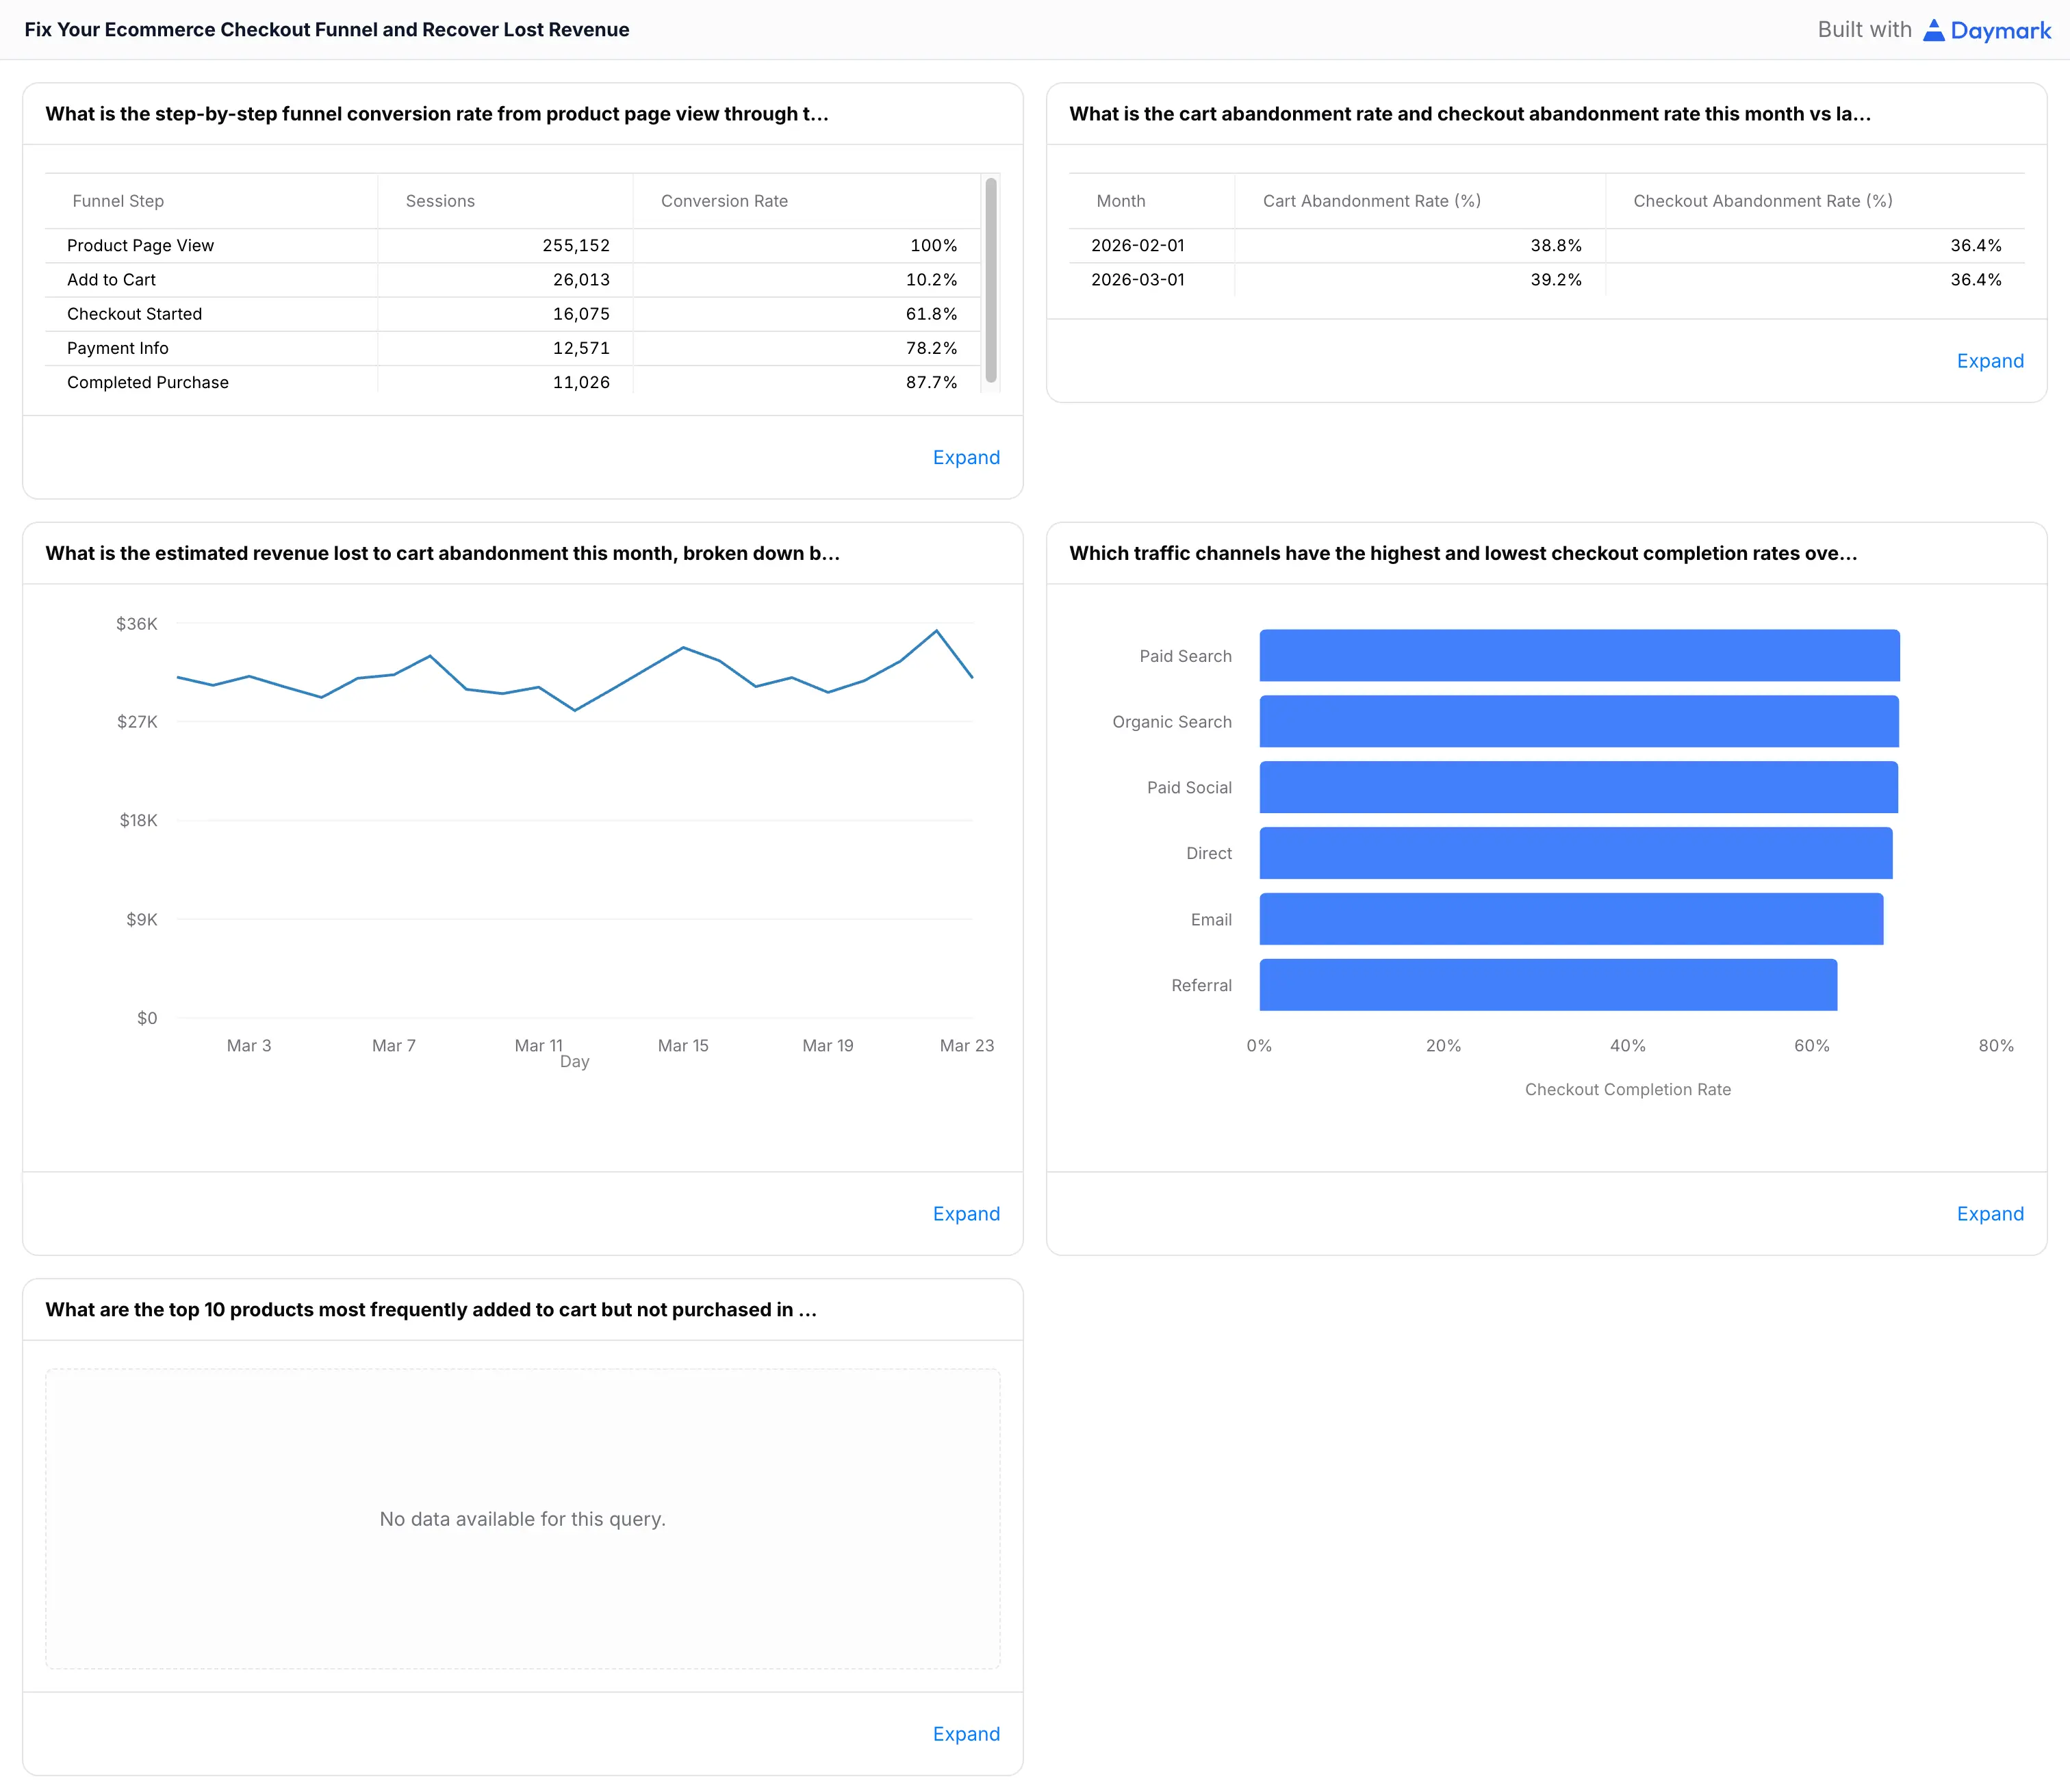
Q5. Which traffic channels have the highest and lowest checkout completion rates over the last 30 days?
Q6. What are the top 10 products most frequently added to cart but not purchased in the last 30 days?