Feb 16, 2026 · 12 min read
What Is Web Analytics? A Beginner’s Guide to Understanding Your Website Data
First-hand guidance from the Daymark team on analytics workflows, growth reporting, and the operational metrics teams use to make decisions.
Web analytics is the fastest way to move from opinions to evidence on what your website is actually doing. This beginner guide explains the core concepts, practical workflow, and tool choices you need to measure traffic quality, engagement, and conversion performance with confidence in 2026.
What Is Web Analytics?
Web analytics is the process of tracking, collecting, and analyzing data about how visitors use your website. It’s the foundation of data-driven decision making for online businesses. By measuring key metrics like page views, unique visitors, session duration, and conversion rates, you gain a clear picture of user behavior.
In other words, web analytics helps you understand what people do on your site – what they click, how they navigate, and what actions they take. This insight turns raw data into actionable information, revealing strengths and weaknesses in your website and marketing efforts.
Why Is Web Analytics Important?
Web analytics is essential because it transforms guesswork into smart strategy. Without data, you’re flying blind. Analytics lets businesses measure the success of marketing campaigns, content, and design changes. For example, if you launch a new email campaign or social media ad, web analytics shows whether those efforts drive traffic and conversions.
In a competitive digital landscape, understanding user engagement and return on investment (ROI) is key. Web analytics also helps identify problems – like high bounce rates or broken links – so you can fix issues before they harm your bottom line. Ultimately, using web analytics is about getting the most out of every visitor by optimizing your site and marketing over time.
Who Uses Web Analytics?
Almost anyone with a website can benefit from web analytics. Here are some common users:
-
Digital Marketers: They monitor campaign performance and traffic sources, adjusting strategies to get the best return.
-
E-commerce Managers: They track sales funnels, cart abandonment rates, and product page views to increase online revenue.
-
Content Creators and Bloggers: They see which articles and pages attract readers, helping them produce more of what the audience loves.
-
Product Managers and UX Designers: They analyze user flows and behavior to improve site design and product features.
-
Startup Founders: They use insights to validate ideas, understand customer needs, and pitch to investors with real data.
-
Data Analysts: They dig deep into analytics to uncover trends, user segments, and predictive insights.
No matter the industry or size of business, anyone looking to grow an online presence or improve digital performance uses web analytics to guide decisions.
What Can Web Analytics Tell You? (Key Insights)
Web analytics provides a wealth of information. Here are some key insights you can gain:
-
Traffic Sources: Discover how visitors find your site (e.g., search engines, social media, referrals, or paid ads). This tells you which marketing channels are driving the most traffic and conversions.
-
Audience Demographics: Learn who your audience is, including their location, language, device (mobile vs. desktop), and even interests. This helps in tailoring content and ads for your real audience.
-
User Behavior: See what users do on your site – which pages they visit, how long they stay (session duration), and where they drop off. High bounce rates on a page can indicate content or usability issues.
-
Conversion Funnels: Track steps users take to complete goals (like signing up, purchasing, or downloading). Analytics reveals where people abandon the funnel, so you can optimize those pages.
-
Engagement Metrics: Metrics like pages per session, time on page, and scroll depth show how engaging your content is. Are visitors reading whole articles or leaving immediately?
-
Content Performance: Identify your most popular pages, articles, or products. You can see which content attracts new visitors or keeps them coming back.
-
Campaign Effectiveness: If you run ads or email campaigns, you can tag links to see exactly which campaign brought in traffic or sales. This measures ROI and helps allocate budgets wisely.
-
User Feedback (Qualitative Insight): Some analytics tools (like Hotjar) provide heatmaps and session recordings. These show where users click or how they scroll, giving clues about user experience.
In summary, web analytics turns numbers into a story about your site’s audience, behavior, and overall performance. By regularly reviewing these insights, you can make informed improvements to your website and marketing.
To dive deeper into the specific metrics, check out our guide: Key Web Analytics KPIs to Track.
Web Analytics Examples (With Scenarios)
-
E-commerce Optimization: Imagine an online retailer notices many shoppers add items to their cart but never complete checkout. Web analytics reveals that a high percentage of users drop off on the shipping details page. By simplifying the checkout form and clarifying shipping costs, the retailer reduces abandonment and boosts sales. In this scenario, analytics guided a targeted fix that improved conversions.
-
Content Strategy for a Blog: A travel blog uses analytics to see which destinations and topics attract the most readers. The data shows posts about budget travel and Europe have the highest engagement. With this insight, the blogger creates more similar content and promotes those posts on social media, driving even more traffic. Here, analytics helped tailor content strategy to audience interests.
-
Startup User Retention: A SaaS startup tracks user onboarding with Mixpanel. They notice that new users who complete a specific tutorial have a much higher retention rate after one month. They decide to make that tutorial mandatory in the signup flow. After implementing this change, overall user retention increases. In this case, analytics identified a key action that leads to user success.
-
Marketing Campaign Adjustment: A company runs ads on Google and Facebook. Web analytics shows that although Facebook ads bring more traffic, Google ads generate twice the conversions. Armed with this insight, the marketing team reallocates budget to Google Ads and refines the Facebook campaign message. This scenario demonstrates using analytics to optimize ad spend.
These examples highlight how web analytics can solve real problems: from increasing sales and user retention to improving content and marketing. In each case, data-driven decisions lead to better outcomes.
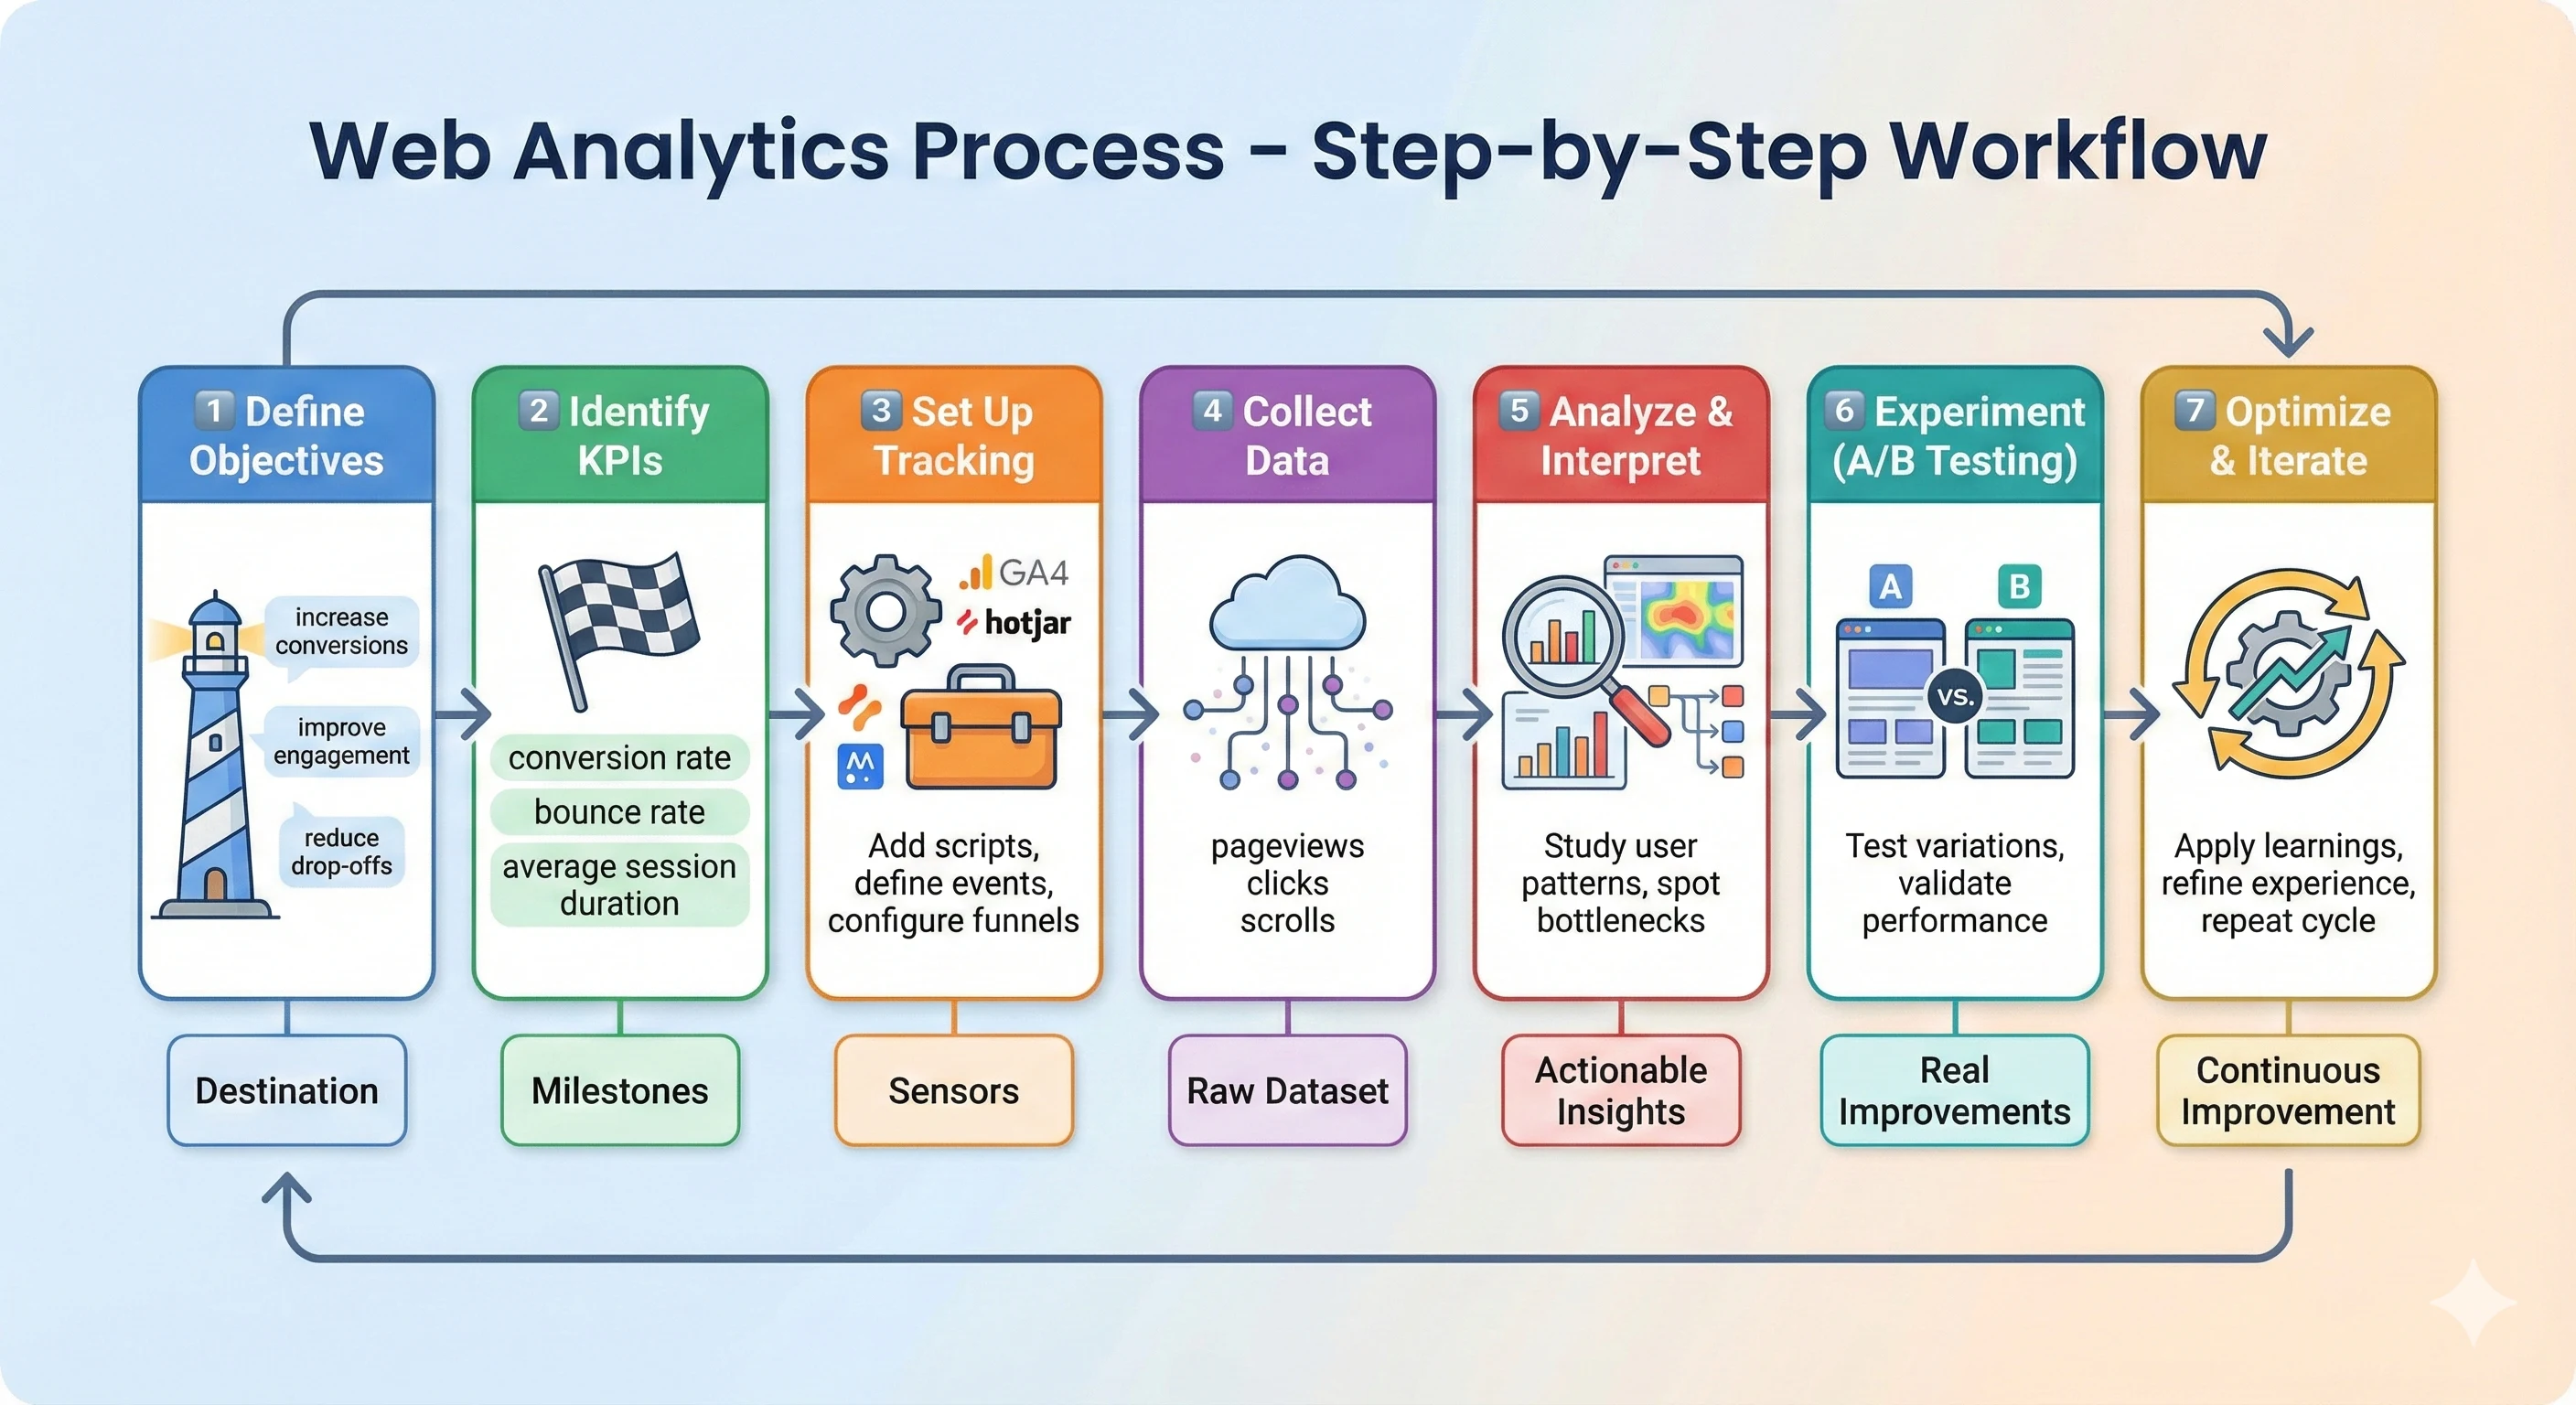
Web Analytics Process (Step-by-Step Workflow)
A successful analytics strategy isn’t just about installing a tool it’s about following a consistent, structured workflow. Here’s a simple, practical step-by-step process to help you turn data into meaningful action:
-
Define Clear Objectives
Start with the “why.” What do you want your website to achieve? More sign-ups, higher sales, better engagement, or improved user experience? Defining your core business objectives sets the direction for your analytics efforts and prevents you from drowning in irrelevant data.
-
Identify the Right KPIs
Once you know your goals, choose KPIs (Key Performance Indicators) that accurately measure progress. For example:
-
For sales: conversion rate, revenue per visitor
-
For content: time on page, scroll depth
-
For marketing: traffic source performance, cost per acquisition
KPIs act as your compass, helping you stay aligned with your goals.
-
-
Set Up Tracking Properly
Install the right tracking tools Google Analytics 4, Mixpanel, Hotjar, or any platform that fits your needs. Make sure to:
-
Place tracking scripts on all pages
-
Configure events (clicks, form submissions, purchases)
-
Set up goals and funnels
-
-
Collect Data Consistently
Let the tools gather data over a meaningful period. Avoid drawing conclusions too early patterns need time to emerge. Ensure your tracking setup is running smoothly and data remains clean (filter out bots and internal traffic).
-
Analyze & Interpret Insights
Now the real magic happens. Dive into the numbers to understand:
-
Where users come from
-
What they do on your site
-
Where they drop off
-
What’s driving conversions
Instead of looking at isolated metrics, focus on trends and relationships. Convert observations into hypotheses.
-
-
Experiment (A/B Testing)
Use your insights to create experiments. Examples:
-
Test two versions of a landing page
-
Try different CTAs
-
Change page layout or copy
A/B testing validates what’s working and eliminates guesswork. Even small changes can lead to significant improvements.
-
-
Optimize and Iterate Continuously
Web analytics is not a one-time project it’s an ongoing cycle. After testing, implement the winning variation, monitor performance, and repeat the process. Websites evolve, user behavior changes, and new opportunities constantly emerge.
Accurate tracking is the backbone of reliable analytics.
Web Analytics Tools (Top Tools of 2025)
There are many tools available for web analytics, each with unique strengths. Below is a comparison table of five popular tools, along with their pros, cons, and best use cases:
| Tool | Pros | Cons | Best Use Case |
|---|---|---|---|
| Google Analytics 4 | Free and widely used; integrates with Google Ads and Search Console; event-based tracking for modern analytics. | Steep learning curve with new interface; privacy changes reduced some data; sampling in free version. | General website and e-commerce tracking, marketing attribution. Ideal for businesses of all sizes using Google ecosystem. |
| Mixpanel | Advanced event and funnel analysis; excellent user segmentation and cohort analysis; intuitive dashboards. | Can be expensive for high traffic sites; limited session-level data. | SaaS and product-led companies focusing on user behavior and product engagement. |
| Hotjar | Visual tools like heatmaps, session recordings, and polls; easy to implement; great for UX feedback. | Not a full analytics suite; limited quantitative data; free plan has data caps. | UX designers and marketers analyzing user experience and on-page behavior. |
| Amplitude | Powerful product analytics and growth insights; detailed cohort analysis; unlimited user tracking in enterprise version. | Complexity can be high; pricing can be steep for small businesses. | Product and growth teams at tech companies that require in-depth user journey analysis. |
| PostHog | Open-source and self-hosted option for data ownership; combines analytics, heatmaps, and experiments; flexible customization. | Smaller community and ecosystem; setup and maintenance require more technical work. | Companies needing full data control and a single platform for analytics and experimentation. |
Each of these web analytics tools offers different perspectives. Google Analytics 4 is great for broad website metrics and marketing attribution. Mixpanel and Amplitude shine for detailed product analytics and user journeys. Hotjar provides qualitative insights into user experience. PostHog appeals to teams that value data privacy and an all-in-one platform. Choosing the right tool depends on your specific needs, budget, and technical capacity.
Best Practices for Effective Web Analytics
-
Set Clear Goals and KPIs: Before diving into data, define what success looks like. Identify key performance indicators (KPIs) such as conversion rate, bounce rate, or revenue per visit. Clear goals ensure you measure the right metrics.
-
Implement Proper Tracking: Use tags, pixels, and events to capture all relevant user actions. Make sure tracking codes (like Google Analytics script) are correctly placed on every page. Without accurate tracking, your data will be incomplete.
-
Clean and Organize Your Data: Regularly audit your analytics setup. Remove bot traffic, filter internal staff visits, and fix broken links that skew data. Good data hygiene ensures your insights are based on real user behavior.
-
Segment Your Audience: Break down data by segments like new vs. returning users, traffic source, or geographic region. Segmentation reveals trends that might be hidden in aggregate data, allowing more personalized strategies.
-
Use Dashboards and Reports: Create visual dashboards for at-a-glance metrics. Automated reports keep stakeholders informed. Visualization tools help spot trends quickly and make data understandable for non-analysts.
-
Combine Quantitative and Qualitative Data: Pair hard metrics with qualitative feedback. Use heatmaps or surveys to get context around why users behave a certain way. Quantitative data tells you what happened; qualitative data can explain why.
-
Stay Privacy Compliant: With growing privacy laws (like GDPR and CCPA), ensure your analytics practices respect user consent. Anonymize data when needed and be transparent about cookie usage. Privacy-friendly analytics builds user trust.
-
Test and Iterate: Web analytics isn’t a one-time task. Continuously test changes (A/B tests, new features) and measure results. Use analytics to learn from each test and refine your approach over time.
-
Educate Your Team: Ensure that all stakeholders understand basic analytics concepts. When marketing, product, and development teams speak the same data language, collaboration improves. Encourage a culture of data-driven decision-making.
By following these best practices, your web analytics efforts will be more effective and reliable. Ultimately, the goal is to create a feedback loop: use data to improve your site, then use the improved site’s data to learn even more. This cycle leads to continuous growth and better results from your digital presence.
Web Analytics Implementation Checklist
- Define one primary business outcome and 4-8 supporting KPIs.
- Standardize event names and UTM conventions before reporting.
- Validate tracking quality weekly (missing events, duplicates, bot filtering).
- Build focused dashboards for acquisition, behavior, and conversion.
- Add a decision rule for each KPI threshold (owner + response action).
- Review by segments (channel, device, geo, cohort) every week.
Web Analytics Benchmark Ranges
Use these as directional ranges, not fixed targets:
| KPI | Directional range | How to interpret |
|---|---|---|
| Bounce rate | Often ~35% to 70% by page intent | Higher can be acceptable on single-answer pages. |
| Conversion rate | Often ~1% to 5% for many sites | Segment by channel and device before comparing. |
| Session duration | Highly content-dependent | Compare against your own page-type baseline. |
| Returning visitor share | Varies by model and cadence | Use trend direction and cohort performance first. |
Conclusion: Turning Web Analytics Into Real Growth
Web analytics is no longer optional it’s the engine that powers smart, data-driven decisions in the digital world. Whether you’re a marketer optimizing campaigns, a product manager improving user journeys, a founder tracking growth, or a student learning the ropes, analytics helps you understand what truly matters: your users and their behavior.
By combining the right tools, clear goals, accurate tracking, and continuous optimization, you can transform raw numbers into meaningful insights that drive conversions, engagement, and long-term business success. The key is not just collecting data but learning to interpret it, act on it, and iterate consistently.
If you embrace web analytics as an ongoing process rather than a one-time setup, your website becomes a constantly improving system one that adapts to user needs, maximizes opportunities, and delivers measurable impact.
In a world full of competition, the brands that win are those that listen to their data. Let web analytics be your roadmap to smarter decisions, better user experiences, and sustainable digital growth.
Frequently Asked Questions (FAQs)
What is web analytics?
Web analytics is the practice of collecting, measuring, and analyzing website data (like traffic, user behavior, and conversions) to understand performance and make data-driven improvements.
Which web analytics tool should I start with?
Start with Google Analytics 4 for broad website metrics. If you need deeper product or funnel analysis, consider Mixpanel or Amplitude. For qualitative insights like heatmaps, use Hotjar. Privacy-focused teams often choose PostHog.
How do I choose the right KPIs?
Tie KPIs directly to your goal and audience. For example, track conversion rate and CAC for acquisition, activation and retention for product, and revenue per visit for e‑commerce. Keep the set small and actionable.
Is Google Analytics 4 enough for product analytics?
GA4 covers marketing and web performance well, but product teams often add tools like Mixpanel or Amplitude for event-level user journeys, retention cohorts, and funnel analysis.
How can I stay compliant with privacy laws (GDPR/CCPA)?
Collect consent where required, anonymize IPs, avoid storing personally identifiable information in analytics events, and document your data usage. Consider privacy-friendly tools or self-hosting if needed.