Feb 16, 2026 · 15 min read
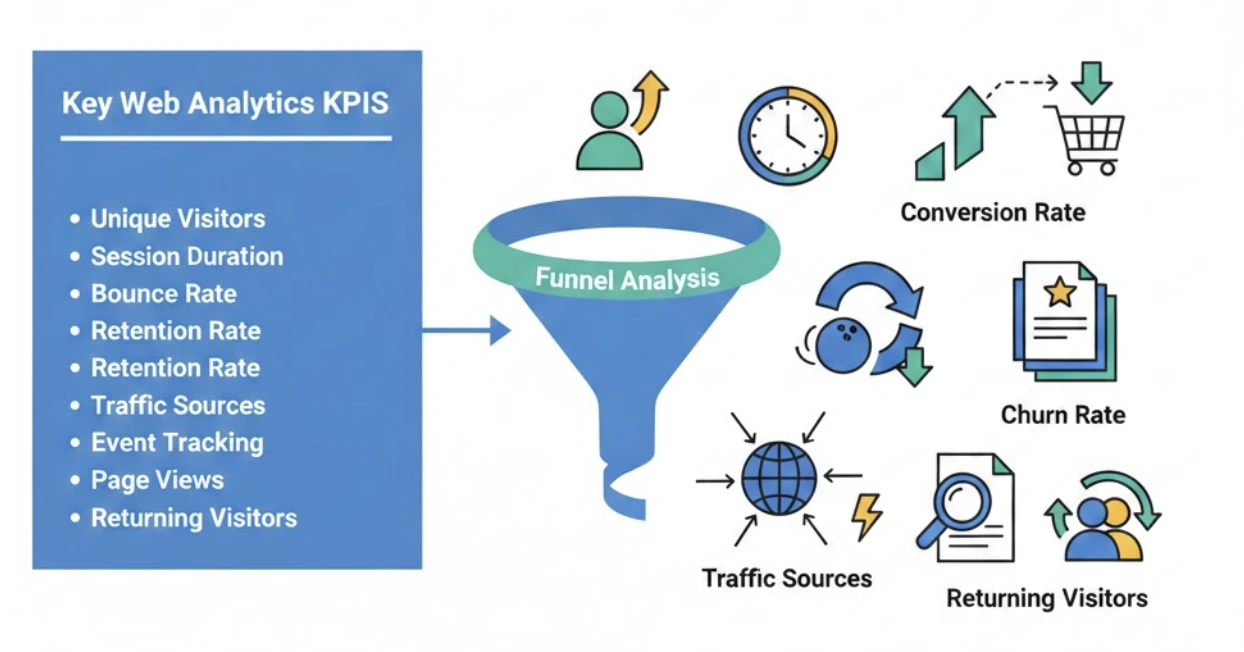
10 Web Analytics KPIs to Track
First-hand guidance from the Daymark team on analytics workflows, growth reporting, and the operational metrics teams use to make decisions.
If you only track a handful of website metrics, track the ones that connect behavior to outcomes. This guide covers the highest-signal web analytics KPIs for traffic quality, engagement, conversion, and retention so you can prioritize actions that improve growth, not just reporting.
Web analytics KPIs (key performance indicators) measure how a website is performing and link your marketing efforts to overall business goals.
By tracking the right metrics, you can see exactly how visitors interact with your site – for example, which pages hold their attention or where they drop off – and make data-driven improvements.
In this guide we’ll break down the most important website metrics (KPIs) to monitor. We’ll explain what each metric means, how it’s calculated, and why it matters. For instance, you’ll learn how to find unique monthly visitors, calculate conversion and churn rates, improve bounce rate, and more, so that you can optimize your site’s performance for any audience.
New to the topic? What is web analytics covers the fundamentals before you dig into individual KPIs.
If you want to turn these KPIs into a working reporting setup, our Google Analytics growth ROI analysis, Google Analytics integration, and conversion rate guide are the best next stops.
KPI Benchmark Snapshot (Directional)
| KPI | Directional range | Why it matters |
|---|---|---|
| Bounce rate | Often ~35% to 70% by page type | Helps identify intent mismatch and UX friction. |
| Conversion rate | Often ~1% to 5% for many sites | Core indicator of funnel effectiveness. |
| Returning visitor share | Model-dependent | Reveals audience loyalty and content stickiness. |
| Cart abandonment rate | Often ~55% to 75% in ecommerce | Highlights checkout friction and revenue leakage. |
| Churn rate | Business-model specific | Signals retention health and growth sustainability. |
1. Traffic Sources
What is website traffic source
Traffic sources show where your visitors are coming from. Common channels include organic search (SEO), direct (typing URL/bookmarks), referral (links from other sites), social media, email campaigns, and paid ads.
Analytics tools classify each visit’s source/medium using referrer data or tagging. For example, visits from Google search are “Organic Search,” from Facebook “Social,” etc.
Why it matters: Understanding sources reveals which marketing channels drive visitors. If organic search is your largest source, your SEO is working; if social or email drive traffic, your content promotion is effective. You can allocate budget and effort to high-performing channels and troubleshoot underperforming ones. For instance, if referral traffic is low, consider more link-building partnerships.
How to find Traffic Source
Check your analytics acquisition reports (e.g. GA4’s Traffic Acquisition). These break down sessions by channel/source. You can also compare channels’ engagement and conversion rates. Tag campaign links (UTM parameters) to distinguish different marketing efforts. Regularly reviewing these reports helps you spot trends, like rising social traffic or drops in paid search visits.
2. Unique Visitors
What are Unique Visitors
Unique visitors are the count of distinct individuals visiting your site in a given time period. Each person is counted once (repeat visits don’t increase the count), typically identified by a cookie or user ID.
Why it matters: This gauges your site’s reach and brand awareness. A growing unique visitor count shows new people are finding your site, while declines may signal waning interest. Unlike total visits, it filters out repeat visits, giving a clear picture of audience size.
How to find Unique Visitors
Use analytics tools (e.g. Google Analytics 4) which automatically de-duplicate visitors
In GA4, the “Users” or “Total Users” metric shows unique visitors for your selected date range. For example, GA4’s Reports > Engagement > Pages and screens shows “Users” per page
You can change the date range to get unique monthly visitors
Example: If 10 different people visit your site this month (even if one person visits 3 times), unique visitors = 10.
3. Page Views
What are Page Views
A page view is counted each time a page on your site is loaded by a user. If a visitor clicks from one page to another, each load is a separate page view. Even refreshing the same page counts as another view. It’s a basic measure of content exposure.
Why it matters: It reflects raw traffic volume to each page. High page views on a page mean lots of eyeballs (which often correlates with awareness and interest). Marketers use page views to gauge which content draws attention. For example, a blog post with many page views may boost brand awareness and generate signups
It’s also a component of ROI calculations. However, page views alone don’t account for who or why; always consider them alongside unique visitors and engagement metrics.
How to find Page Views
Analytics reports show total page views per page. In GA4’s Pages and screens report, the “Views” column shows page views
You can also compare “Unique Page Views” (counting repeat visits as one) for context. Combine page view counts with session and conversion data to understand how traffic flows through your site.
4. Returning Visitors
What is Returning Visitors
Returning visitors are users who have been to your site before and come back again
Analytics identify them via cookies or login IDs. Essentially, a user is “returning” if they revisit after their first session.
Why it matters: It indicates loyalty and sustained interest. A high percentage of returning visitors means your content or offerings are sticky – people find enough value to return
This is often a goal of content marketing: keep readers coming back. It’s a proxy for audience quality – returning users are likelier to convert or become customers. Tracking returning visits over time can show whether your site is effective at building a repeat audience.
How to find Returning Visitors
Analytics platforms (GA4, etc.) report new vs. returning users. In GA4, use the “User acquisition” or “Retention” reports to see the share of sessions by returning visitors. Segment your reports by user type (new/returning).
You may also examine how frequently users return (e.g. 2–3 visits, 4–9 visits, etc. using tool like Klipfolio)
To increase returning traffic, focus on engaging content, email newsletters, and remarketing to invite people back.
5. Bounce Rate
What is Bounce Rate
Bounce rate is the percentage of visits in which a user leaves after viewing only one page. A “bounce” happens if they don’t click to any other page (for example, they hit the back button or close the tab)
Why it matters: It signals whether landing pages meet visitor needs. A high bounce rate may indicate problems (e.g. irrelevant content, slow load times, or poor UX), while a low bounce rate suggests users explore further
Exception: On single-page sites or pages that inherently answer a question fully, a high bounce rate may be normal.
How to improve Bounce Rate
Improving your bounce rate requires a mix of technical fixes, content adjustments, and user experience (UX) improvements.
For example: speed up slow pages (Google found a 32% higher bounce probability when load time increases from 1 to 3 seconds) make sure titles, meta descriptions and content align with user intent enhance readability (clear headings, bullet points); and improve UX by removing intrusive pop-ups or confusing navigation.
In analytics,

For example, 10,000 single-page sessions out of 100,000 total sessions = 10% bounce rate
Summary Checklist:
| Area | Action | Tool to Use |
|---|---|---|
| Speed | Compress images & scripts | Google PageSpeed Insights |
| User Intent | Put the answer at the top | Surfer SEO (or Clearscope) |
| Navigation | Add internal links to other posts | Link Whisper |
| Analysis | Check which pages have high bounces | Google Analytics (GA4) |
| UX | See where users click/scroll | Hotjar or Crazy Egg or Microsoft Clarity |
6. Session Duration
What is Session Duration
Average session duration is the average length of time visitors spend on your site per session. In other words, total time on site divided by number of sessions
Why it matters: It indicates visitor engagement and content effectiveness.
Longer sessions often mean visitors are finding your content engaging or useful. Short sessions may suggest users aren’t finding what they need or are leaving quickly, prompting a content or design review.
Session duration also correlates with other metrics – for example, longer sessions generally lead to higher conversions
How to find or calculate Session Duration
In analytics (e.g. GA4’s engagement) you can view “Average Engagement Time” per session. Or calculate manually:

For instance, if 100 sessions total 10,000 seconds, average session duration = 100 seconds. GA4 and other tools compute this automatically.
7. Funnel Analysis
What is Funnel Analysis
Funnel analysis tracks the steps users take toward a goal (e.g. a purchase or signup). You define a sequence of events (like “View Product → Add to Cart → Checkout → Purchase”) and measure the percentage of users who advance from step to step.
Why it matters: It highlights exactly where users drop off, so you can identify bottlenecks in your conversion flow. For instance, you might find many users add items to cart but abandon at checkout, indicating an issue at that step. Analyzing the funnel helps you fix the right step to improve overall conversions.
How to use
Set up funnels in your analytics tool (e.g. GA4’s Funnel Exploration or a product analytics tool like Amplitude). Ensure each conversion step (event) is defined (view item, click add-to-cart, etc.), then view the funnel report. The report will show the drop-off at each step.
You can also segment funnels (e.g. by traffic source or user cohort) to diagnose issues for specific audiences.
8. Conversion Rate
What is Conversion Rate
Conversion rate is the percentage of visitors who complete a desired action (a “conversion”) on your site. Conversions could be purchases, sign-ups, downloads, etc. It shows how well you turn visitors into customers or leads.
Why it matters: It directly reflects the effectiveness of your site and marketing. A higher rate means more of your traffic is doing what you want (buying, subscribing, etc.). It highlights how well your content, CTAs, and user journey are aligned with user intent.
How to calculate Conversion Rate
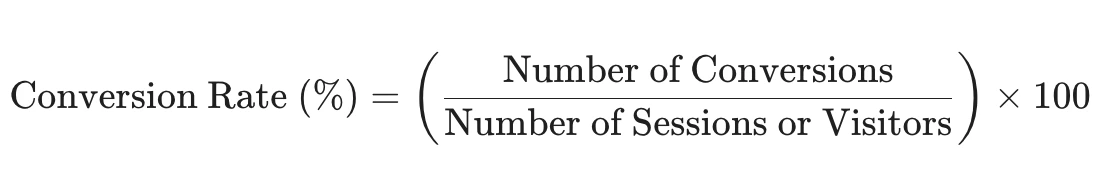
For example, if 50 out of 2,000 visitors make a purchase, conversion rate = (50/2000)×100 = 2.5%.
In tools, you set up goals or conversions and view the rate in analytics reports. To improve it, optimize landing pages and calls-to-action (shorter forms, faster load, clear wording) and run A/B tests on headlines, images, and layout for better performance.
9. Retention Rate
What is Retention Rate
Retention rate measures the percentage of customers or users who stay active over time. It answers “how many customers remain from period start to end”.
For websites, it can also mean what portion of first-time visitors return after a certain period.
Why it matters: It shows loyalty and long-term value. Keeping existing customers is much cheaper than acquiring new ones, and loyal customers often provide referrals and feedback.
A high retention rate means your site or service continues to engage its audience.
How to calculate Retention Rate
Use the standard formula:

where,
S = number of customers at start of period,
E = number at end,
N = number of new customers acquired in period.
For example, start with 100 customers, end with 105, and gained 10 new ones, retention = [(105–10)÷100]×100 = 95%.
Many analytics tools automate cohort retention reports (e.g. GA cohort reports). To improve retention, focus on user experience: engage via email/newsletters, loyalty programs, and quick support. Analyze why people leave (surveys, exit feedback) and add value (new features, helpful content) to keep them coming back.
10. Churn Rate
What is Churn Rate
Churn rate is the percentage of customers or users lost over a period. It’s essentially the inverse of retention
For example, if you retain 90% of customers, churn is 10%.
Why it matters: A high churn rate means your audience is shrinking, undermining growth and revenue. Lower churn means a more stable customer base. Regularly monitor churn so you can spot problems early.
How to calculate Churn Rate
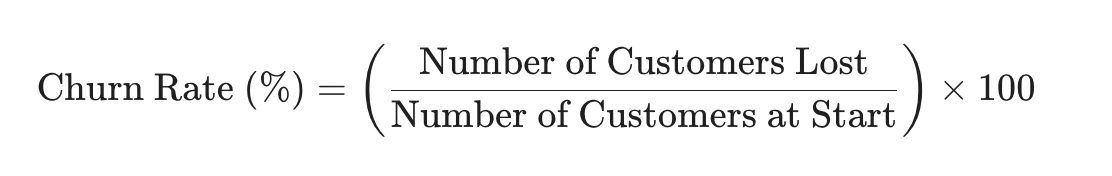
For instance, if you start the year with 100 customers and lose 10 by year’s end, churn = (10/100)×100 = 10%
Analytics cohorts or customer databases track when users stop being active or cancel.
How to reduce Churn Rate
Re-engage at-risk users and fix pain points. For example, send follow-up emails after abandonment, offer discounts or features to long-time users, and collect feedback from leaving users to address issues. Improving product value, adding loyalty perks, and better customer support can all decrease churn. (Remember: retention% + churn% ≈ 100% for a given cohort.)
| Strategy | Primary Goal | Key Actions to Implement | Churn Type Addressed |
|---|---|---|---|
| Analyze & Understand | Identify why customers leave and who is at risk. | Implement Exit Surveys/Interviews. Monitor "At-Risk" signals (low usage, high support tickets, low NPS). Analyze churn time/stage. | Voluntary |
| Perfect Onboarding | Help customers achieve their first "win" quickly and efficiently. | Focus on Time-to-Value (TTV). Provide personalized onboarding paths. Offer proactive education (tutorials, webinars). | Voluntary (Early Churn) |
| Proactive Engagement | Continuously demonstrate and reinforce the product's value. | Implement usage-based check-ins. Send personalized communication based on behavior. Introduce new features relevant to their use case. | Voluntary |
| Exceptional Support | Turn frustrations into positive experiences and build trust. | Prioritize speed and resolution. Offer multiple support channels (chat, email, self-service). Follow up with low CSAT/NPS scores. | Voluntary |
| Build Loyalty/Community | Increase the "switching cost" and foster a sense of belonging. | Introduce loyalty programs (rewards/discounts for tenure). Create customer forums or groups. Consistently collect and act on user feedback. | Voluntary |
| Manage Involuntary Churn | Prevent churn due to technical or payment failures. | Implement robust dunning management (automated emails for failed payments). Use account updaters to manage expired credit cards. | Involuntary |
Your Bonus Metrics: The Next-Level KPIs
You’ve mastered the core ten now it’s time to move beyond the basics. While the first ten KPIs tell you what is happening overall, these two bonus metrics offer crucial insight into specific user actions and your hidden content stars.
11. Top Pages
What are Top Pages
Top pages are your most visited pages (by pageviews or unique views). Analytics ranks pages by traffic; for example, GA4’s Pages and Screens report shows pages sorted by total “Views” and “Users”. These pages attract the most attention.
Why it matters: Identifies content that resonates with your audience. Knowing your top pages lets you optimize them (e.g. improve calls-to-action, add related links, boost SEO) to maximize conversions.
It also guides your content strategy: you can create more on high-performing topics or promote them further. Focusing on top content can greatly increase ROI.
How to find Top Pages of website
In GA4, go to Reports > Engagement > Pages and screens. Sort by “Views” or “Users” to see pages with highest traffic
Examine metrics like views, unique visitors, and engagement time for each top page. In other tools, look for similar “Top Content” or “Popular Pages” reports.
12. Event Tracking
What is Event Tracking
Event tracking captures specific user actions on your site beyond page loads. An “event” can be a button click, video play, form submission, file download, scroll, etc.
In Google Analytics, events are defined by a category/action/label (like “Video / Play / DemoVideo”) and can even have values. Any interaction you want to measure is tracked as an event.
Why it matters: It shows how users engage with interactive elements. For example, if a user plays a video or clicks a signup button, that’s meaningful engagement. Events also make bounce rate metrics more accurate: if a user triggers an event (like playing video) and then leaves, analytics can count it as engagement rather than a bounce. In short, event data turns any user action into a measurable KPI. You can use it to see which features or content pieces drive interaction.
How to set up
Use Google Tag Manager or your analytics platform to define events. Specify a category and action for each interaction you want to track (e.g., Category: “Button”, Action: “Click Signup”). Once implemented, analytics reports (e.g. GA4’s “Events” reports or a “Top Events” chart) show counts of each event. Examine event reports or “Events Flow” to see where and how often users trigger them.
KPI Implementation Checklist
- Pick one north-star goal and align KPI set to that objective.
- Lock KPI definitions across GA4, dashboards, and reporting meetings.
- Add weekly segment reviews by channel, device, and landing-page group.
- Set threshold-based alerts for conversion drops and engagement anomalies.
- Tie each KPI to one owner and one response playbook.
- Track KPI change after every major UX, content, or campaign update.
Conclusion
Tracking the right web analytics KPIs isn’t just a best practice — it’s the foundation for making smarter, data-driven decisions. Whether you're measuring unique monthly visitors to gauge reach, or analyzing bounce rate and session duration to understand engagement, each metric gives you actionable insights into how your site is performing.
By consistently monitoring key performance indicators (KPIs) like conversion rate, retention, churn, and traffic sources, you'll uncover your website's successes and areas needing attention. Tools like Google Analytics 4, Hotjar, and Mixpanel help turn complex data into clear opportunities for growth.
In the end, it’s not about tracking everything — it’s about tracking what matters most to your goals. Review these metrics regularly, test improvements, and use the insights to drive better content, UX, and business outcomes.
Frequently Asked Questions (FAQs)
What are web analytics KPIs?
They are key performance indicators that measure how your website performs, such as unique visitors, session duration, bounce rate, conversion rate, retention, and churn.
How is bounce rate different from session duration?
Bounce rate is the share of single‑page sessions with no further interaction, while session duration is the average time users spend during a visit. Evaluating them together provides better context.
Which KPIs should I prioritize first?
Start with traffic quality and engagement (traffic sources, unique visitors, bounce rate, session duration) and pair them with one primary conversion metric tied to your goal.
How do I find unique monthly visitors?
Use your analytics tool’s Users metric (e.g., GA4). It deduplicates repeat visits and shows the number of distinct people who visited in a given period.
How can I improve conversion rate?
Align landing pages with visitor intent, speed up pages, simplify forms, clarify CTAs, and A/B test headlines, images, and layouts to reduce friction.