See exactly what powers product growth
Below are examples of insights you can get in seconds with simple questions.
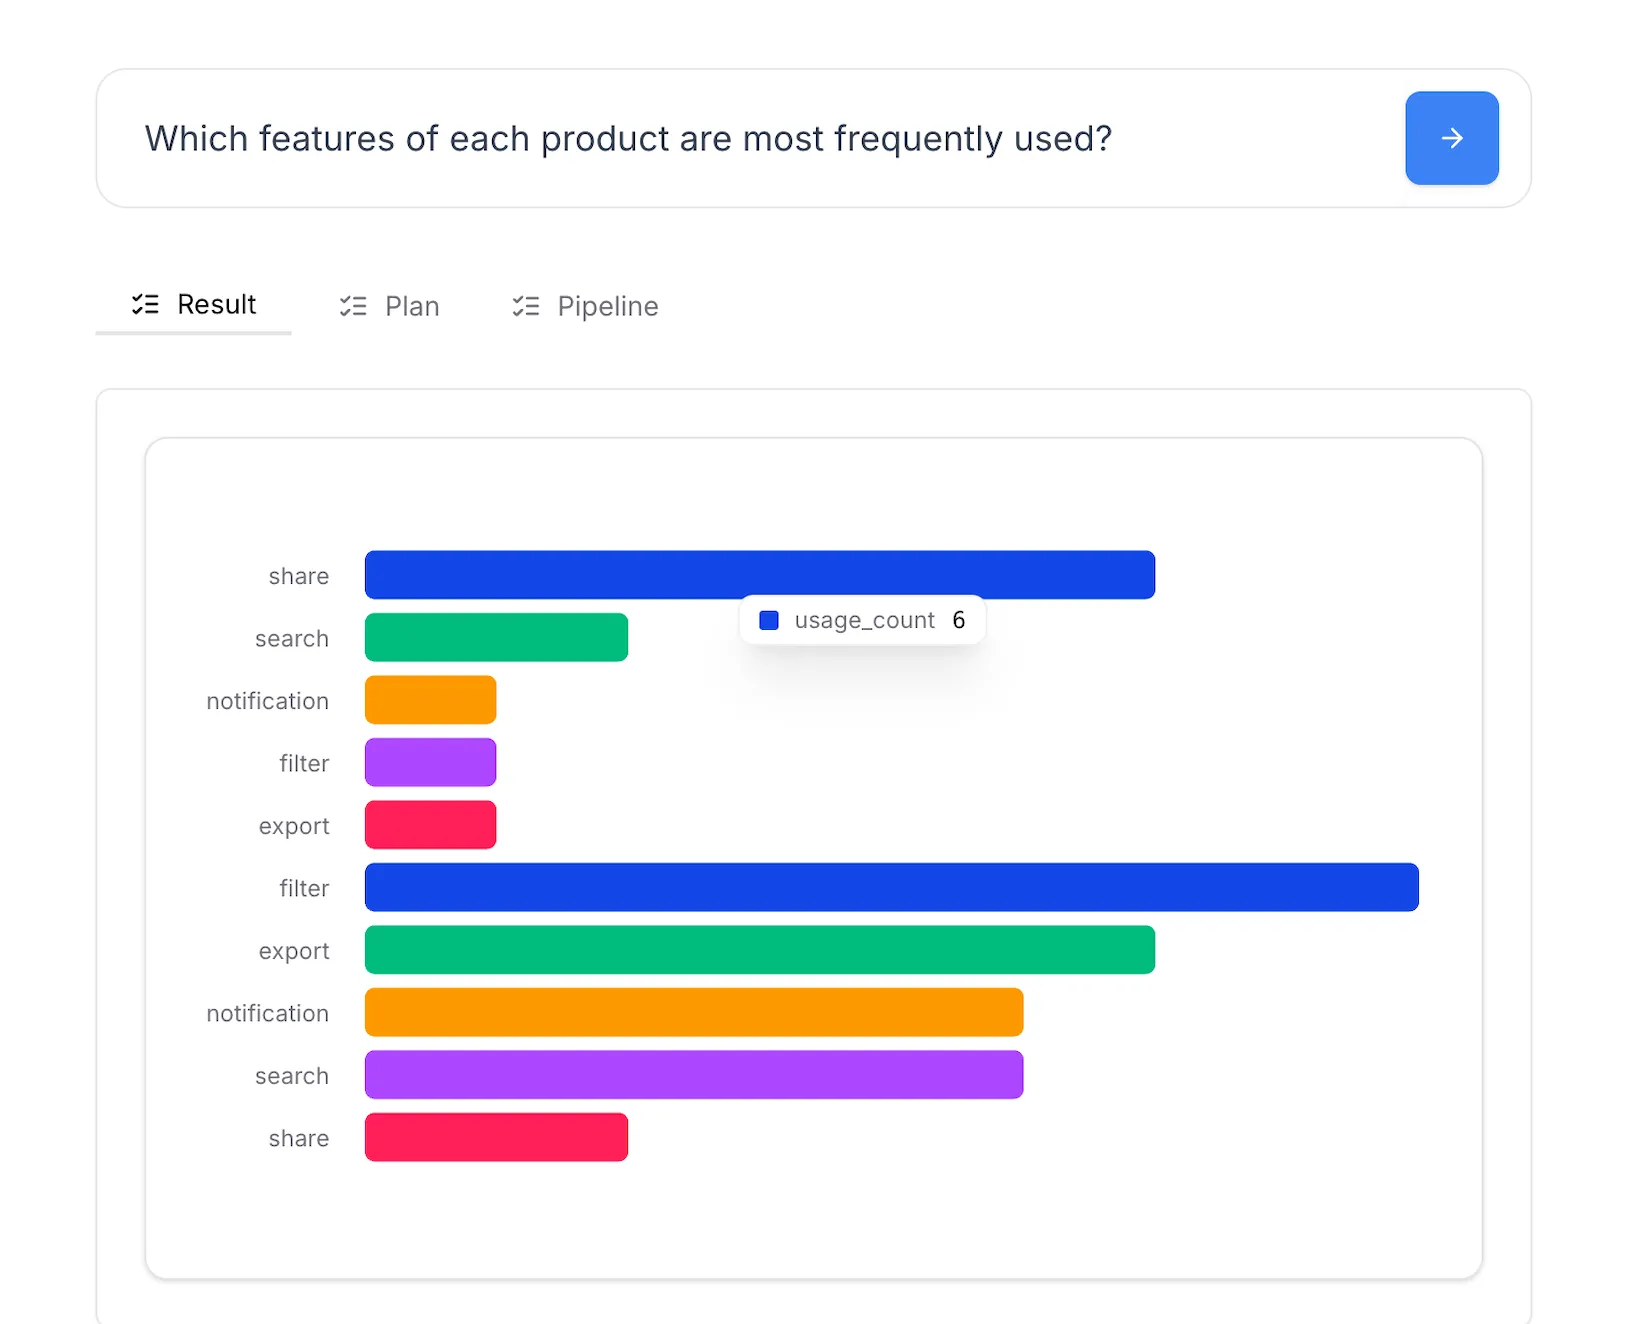
Product Analysis
Identify top-used features, usage frequency, and friction points across the funnel.
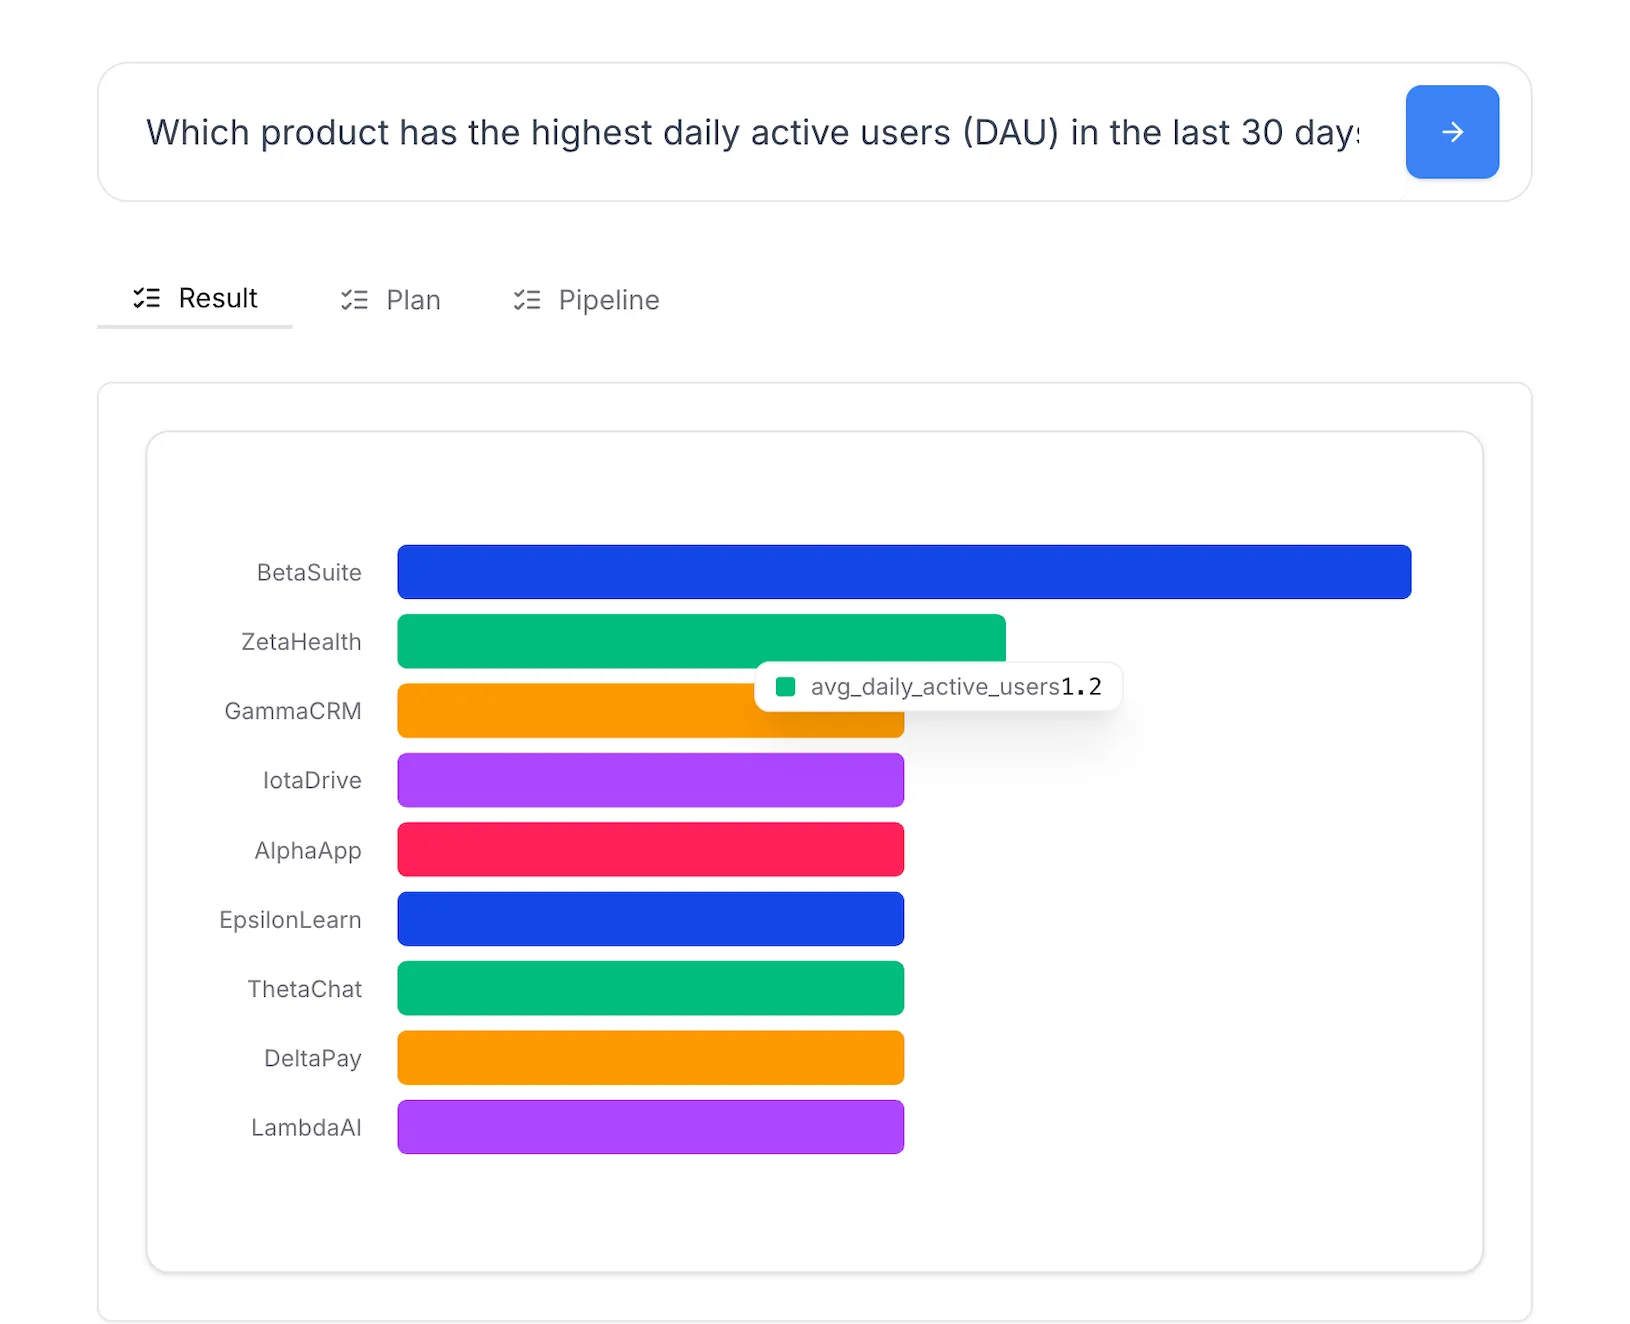
User Engagement
"Which product has the highest daily active users (DAU) in the last 30 days?"
User Retention / Stickiness
"How many users have used a product at least once a week over the past 3 months?"
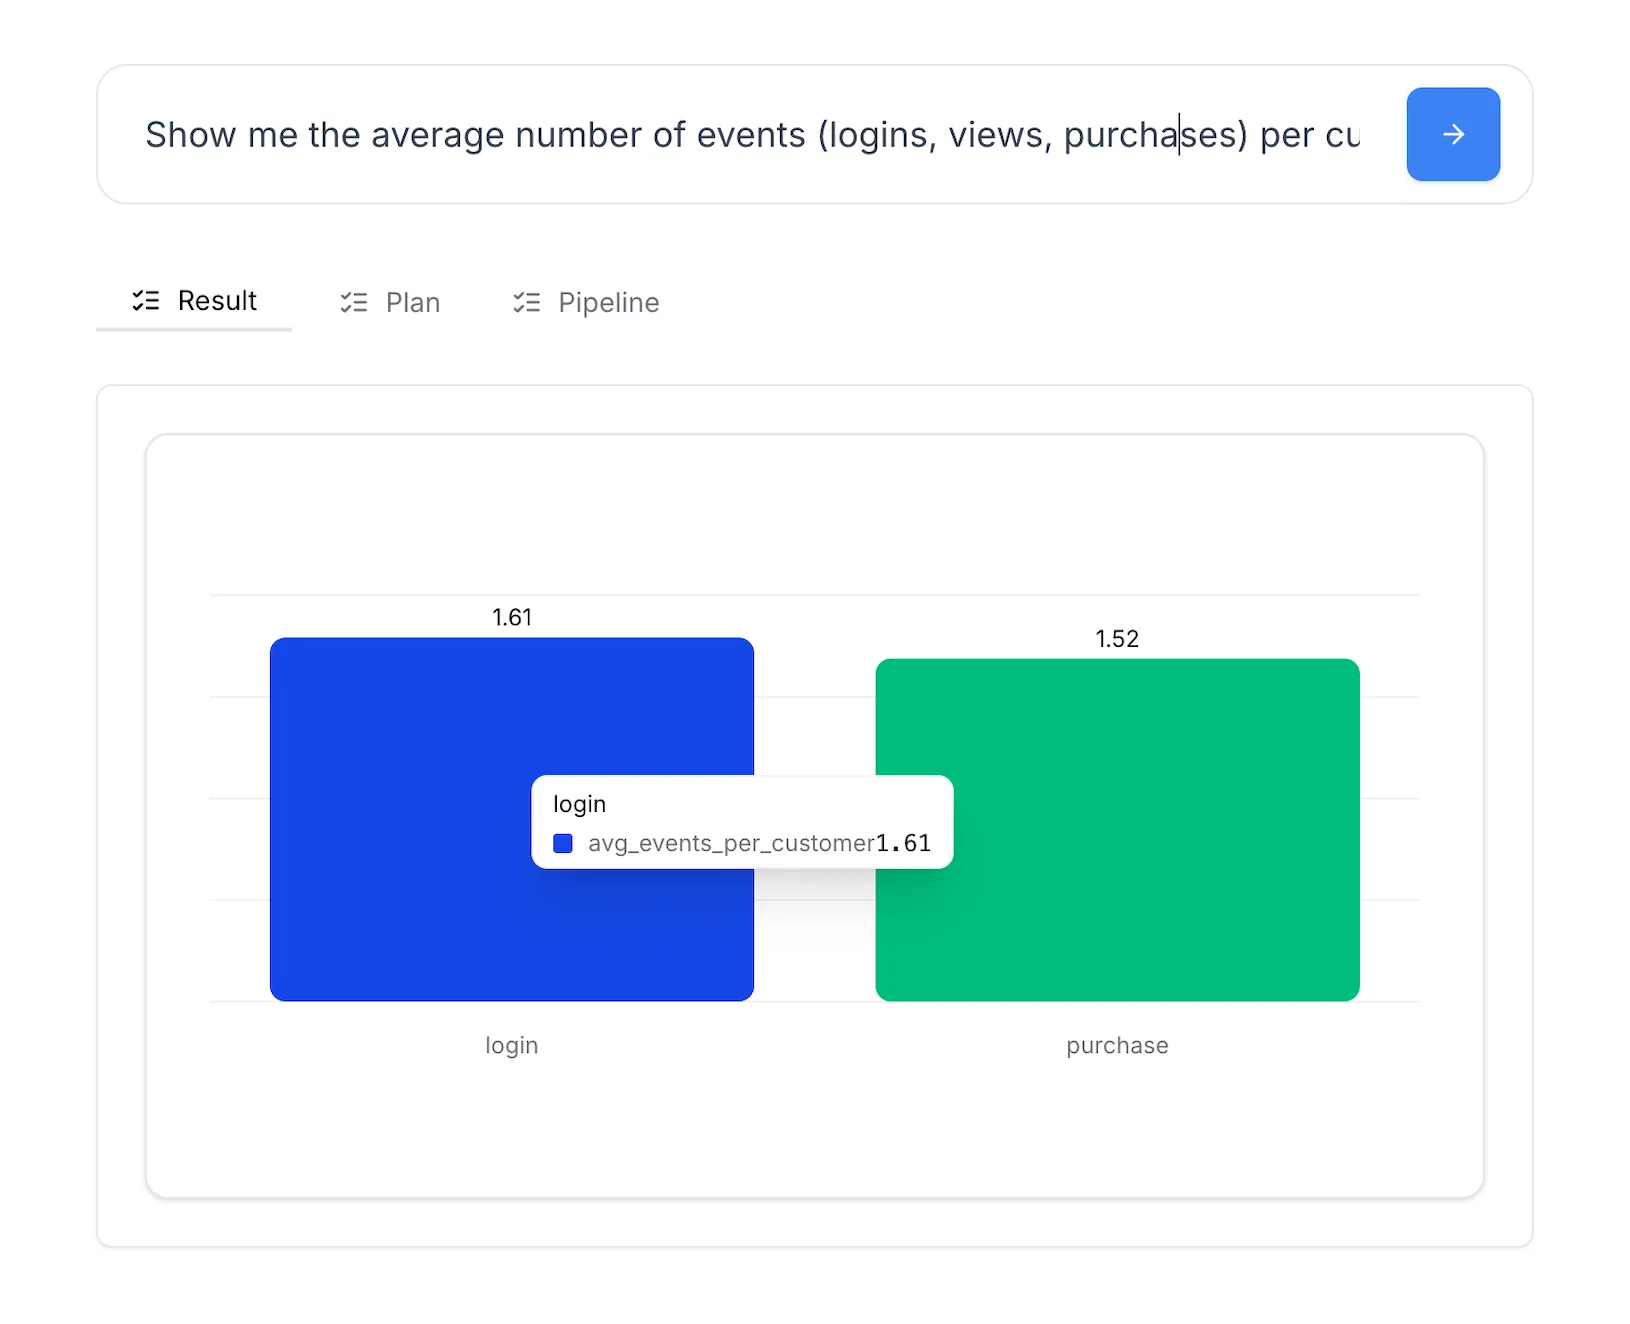
Usage & Transaction Trends
"Show me the trend of logins vs purchases per product over the last 6 months."
Customer Behaviour
Understand how customers navigate your product activation, engagement, and retention and pinpoint friction across journeys.
Conversion & Funnel Analysis
"What is the conversion funnel from signups → product view → add to cart → purchase?"
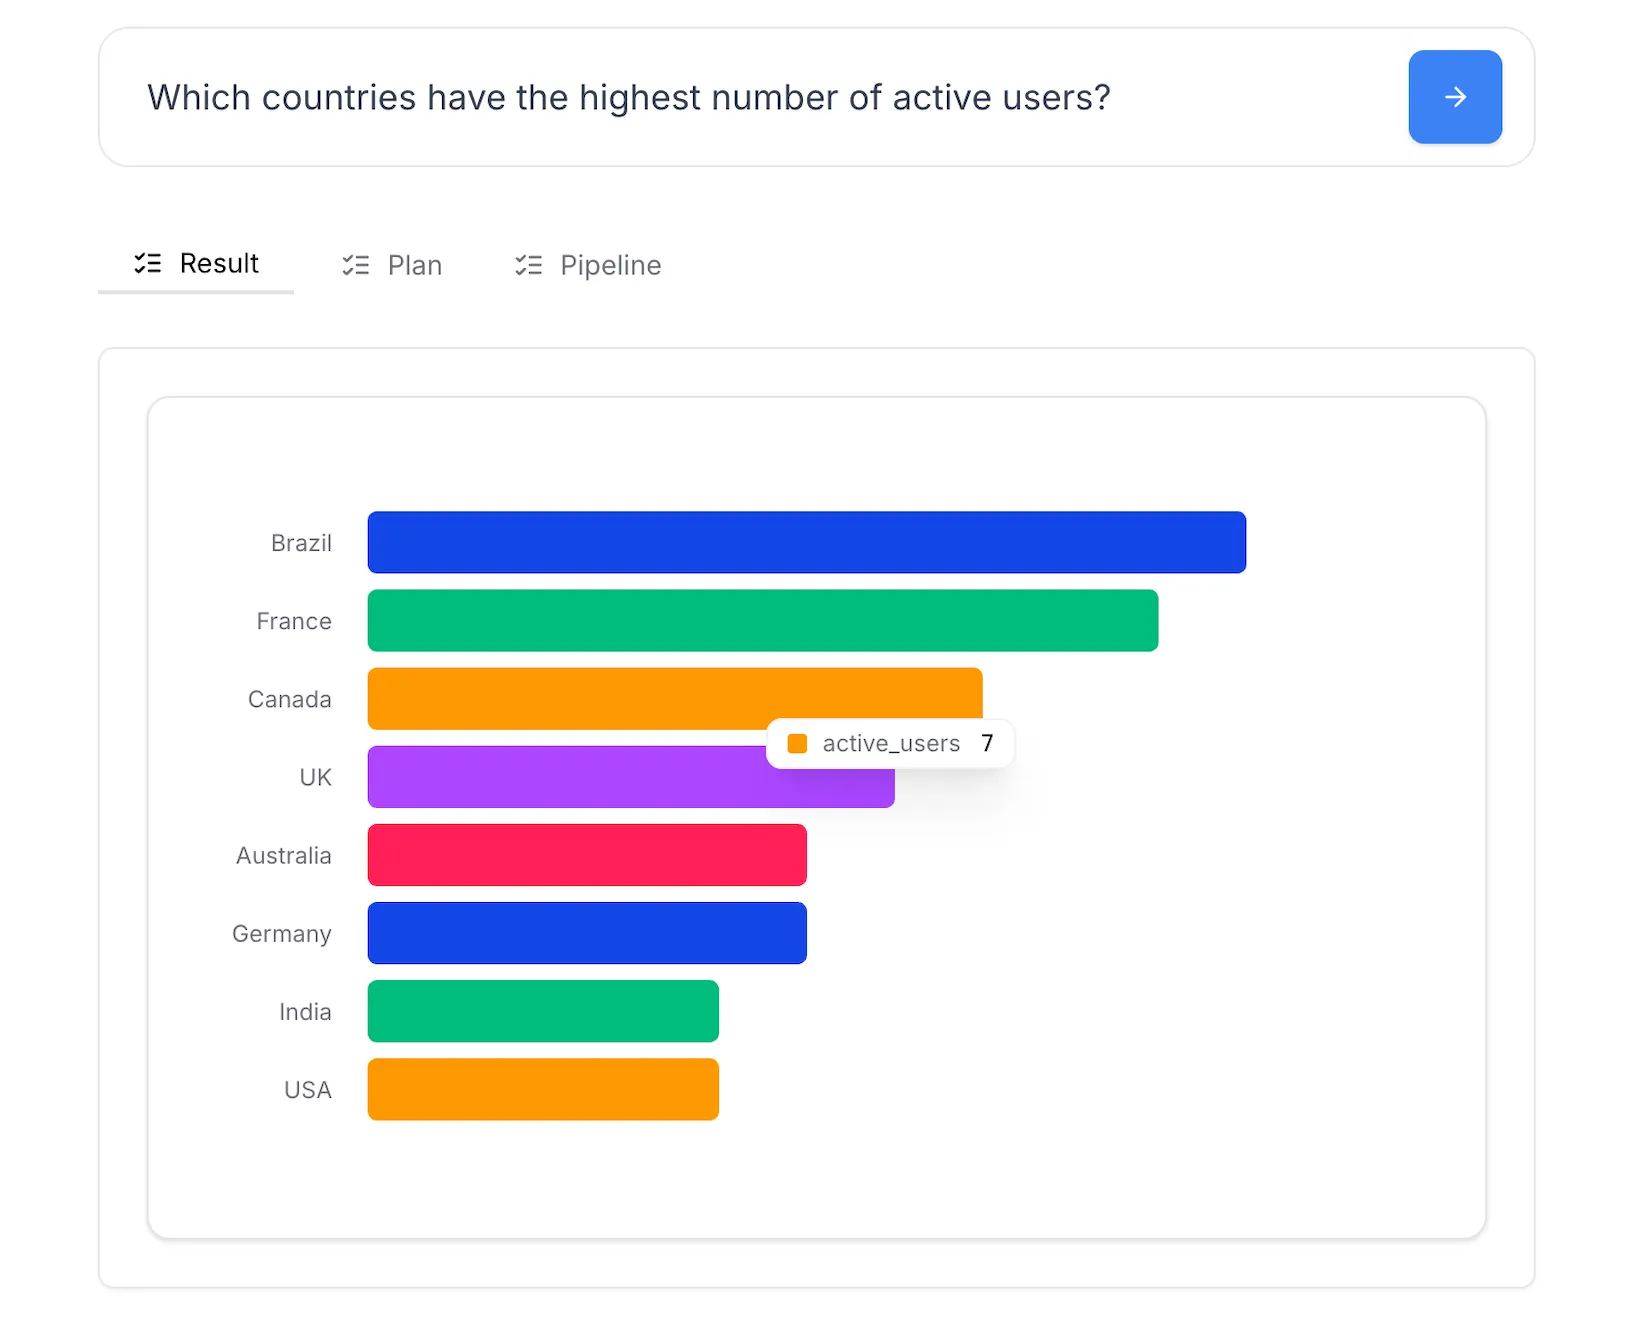
Geographic Distribution
"Which countries have the highest number of active users?"
Churn & Retention
"How many customers have churned (no activity in the last 60 days)?"
Business Outcome
Connect product usage to revenue, conversion, and retention to quantify business impact.
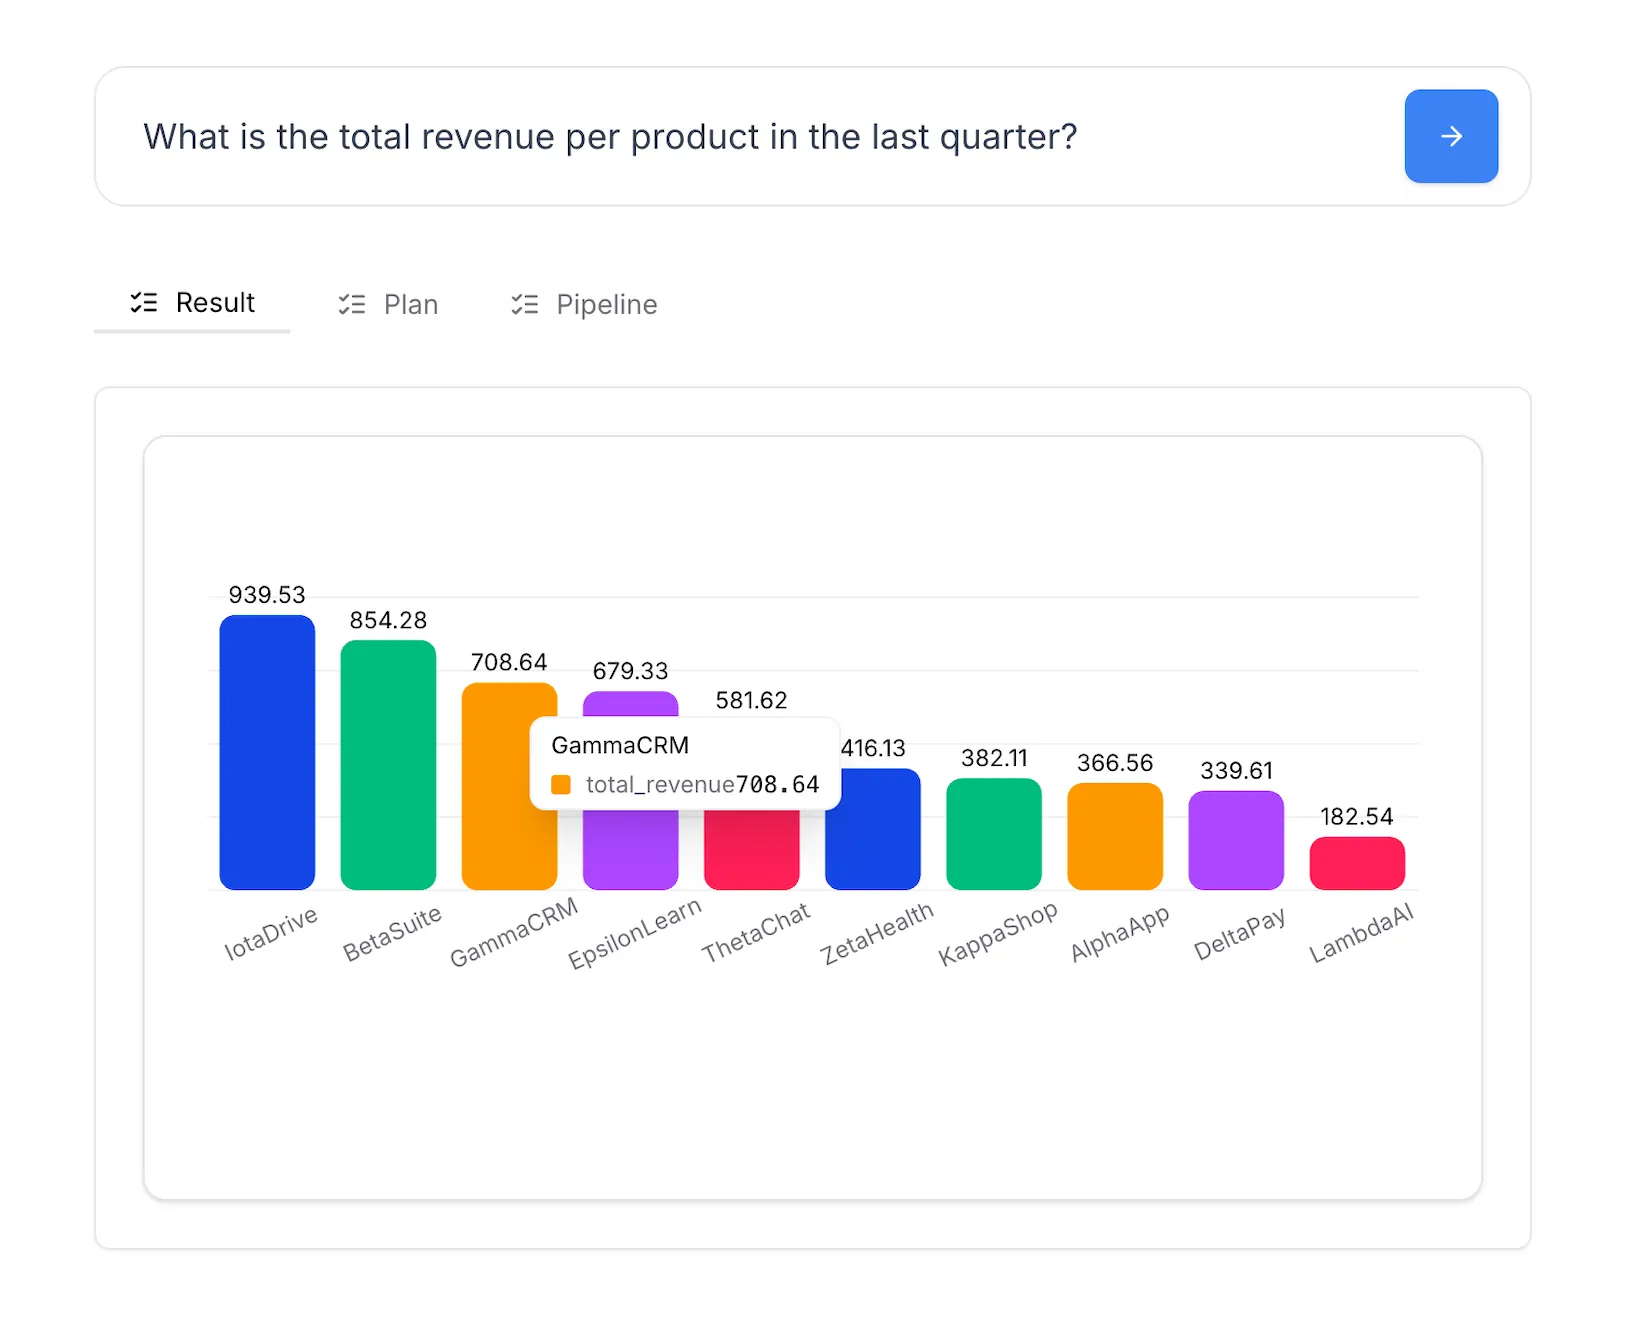
Revenue Analysis
"What is the total revenue per product in the last quarter?"
Revenue Contribution
"Which product contributes the highest share of total revenue?"
Customer Revenue Metrics
"What is the average revenue per customer (ARPU)?"
Works with your data, wherever it lives
Upload your data (Google Sheets, SQL, CSV), ask what you want to know, and get instant insights.
Keep exploring
The metrics, sources, and guides that support this workflow.
Product Stickiness (DAU/MAU Ratio)
Definition, formula, and benchmarks.
Activation Rate
Definition, formula, and benchmarks.
Daily, Weekly, Monthly Active Users
Definition, formula, and benchmarks.
PostgreSQL integration
Connect this source in minutes.
Customer behavior analysis guide
A deeper, practical walkthrough.